Figures & data
Table 1 Parameters Used to Calculate the POSSUM Score
Table 2 Comparison of Predicted and Actual Values of POSSUM and P-POSSUM
Table 3 Types, Number, and Incidence of Complications
Table 4 Comparison of the Complication and Non-Complication Groups
Table 5 Comparison of the Mortality and Survival Groups
Table 6 Stratified Analysis of Predicted Complication Rate
Figure 1 Comparison of the predicted and actual complication numbers in different subgroups.
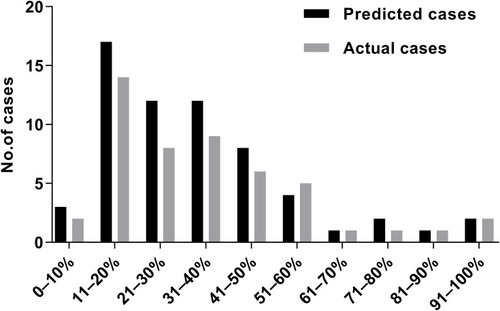
Figure 2 Comparison of the O/E in different subgroups.
Abbreviation: O/E, observed/expected.
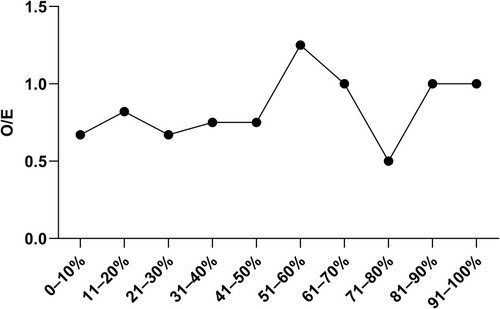
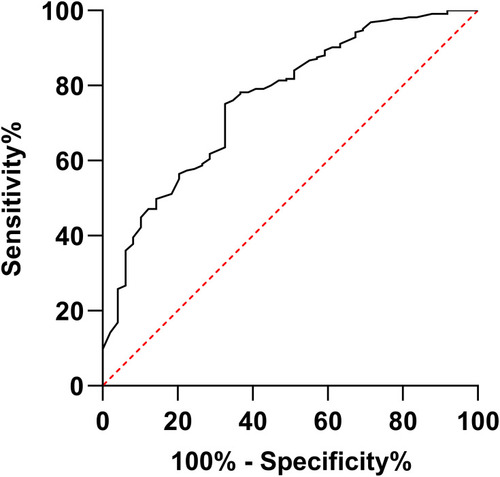
Figure 3 ROC curve to predict complication rate with POSSUM.
Abbreviations: ROC, receiver operating characteristic; POSSUM, physiological and operative severity score for the enumeration of mortality and morbidity.