Figures & data
Table 1 Baseline Characteristics of Elderly AHF Patients
Figure 1 Association of ghrelin levels with (A) NT-proBNP levels and (B) MNA-SF scores.
Note: Pearson’s correlation analysis for the association of log ghrelin with log NT-proBNP levels (A), and log MNA-SF scores (B).
Abbreviation: MNA-SF, Mini Nutritional Assessment Short Form.
Abbreviation: MNA-SF, Mini Nutritional Assessment Short Form.
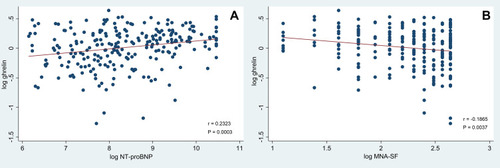
Figure 2 Association of NT-proBNP and ghrelin levels with acute heart failure events.
Note: Penalized cubic spline curves based on the Cox regression model (adjusted by age, sex, smoking status, BMI, RR, heart rate, SBP, DBP, hemoglobin, eGFR, bedside clinical classification, MNA-SF score, serum sodium, and history of HF hospitalization) were used to examine the association of log transformed NT-proBNP (A) and ghrelin (B) levels with AHF adverse events. Solid lines indicate lnHRs, and dashed lines indicate 95% confidence intervals (CI).
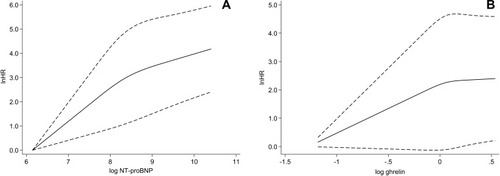
Table 2 C-Statistic Comparisons Between Models
Table 3 Risk Reclassification with Ghrelin Addition
Table 4 Risk Reclassification with Dual Addition of NT-proBNP and Ghrelin
Figure 3 ROC curves of each model for acute heart failure events.
Note: Model 1 (reference) includes RR, eGFR, serum sodium, and history of HF hospitalization; Model 2, Model 1 + log NT-proBNP; Model 3, Model 1 + log ghrelin; Model 4, Model 1 + log NT-proBNP + log ghrelin.
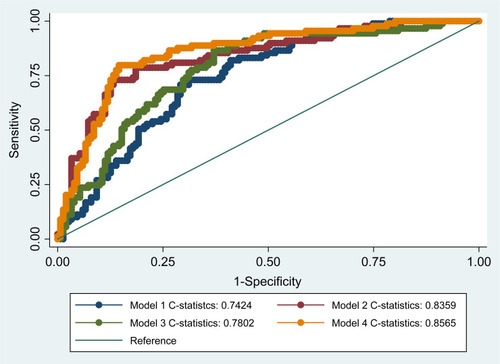
Figure 4 Kaplan–Meier curves of AHF event risks according to models with dual addition of log ghrelin and log NT-proBNP.
Note: AHF events: all-cause mortality and/or readmission due to heart failure.
Abbreviation: AHF, acute heart failure.
Abbreviation: AHF, acute heart failure.
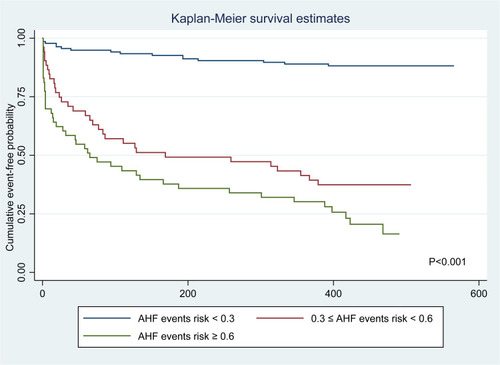
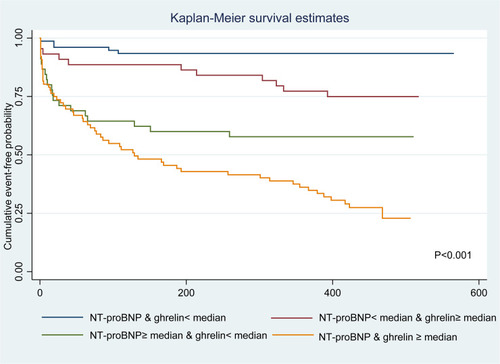
Figure 5 Kaplan–Meier curves of AHF events risk according to NT-proBNP and ghrelin levels.
Note: NT-proBNP median level: 3980ng/mL, ghrelin median level: 1.07ng/mL. AHF events: all-cause mortality and/or readmission due to heart failure. Cumulative event-free probability was compared by log rank test.
Abbreviation: AHF, acute heart failure.
Abbreviation: AHF, acute heart failure.