
Figures & data
Table 1 Characteristics of Participants (n=315)
Table 2 Descriptive Statistics of SOC and Its Components: The Sense of Comprehensibility, Manageability and Meaningfulness
Table 3 Distribution of SOC Scale Values and Its Domains: Low, Average and High Values (n=315)
Figure 1 Distribution of attitudes towards one’s own old age among survey participants.
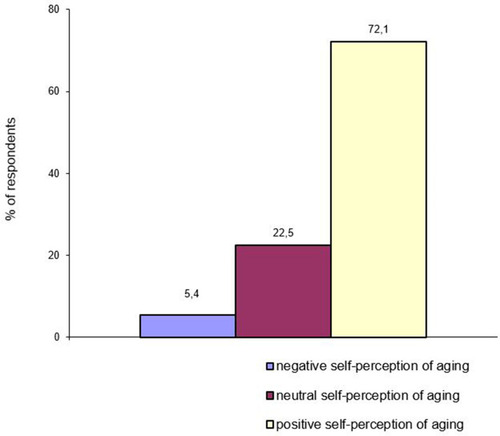
Table 4 Statistical Characteristics of the SOC Scale and Its Domains Depending on Attitudes Towards Old Age
Table 5 Distribution of GDS Scale Values According to Attitudes Towards Old Age (n=315)
Table 6 Statistical Characteristics of the SOC Scale and Its Domains Depending on the Occurrence of Depression (n=315)
Table 7 Distribution of SOC Scale Values (Low, Average, High) According to Explanatory Variables