Figures & data
Figure 1 (A) The fascial boundary of lumbar paravertebral muscles (white circle). (B) The boundary of vertebral body (white circle). Muscle–disc ratio was (muscle area)/(disc area): 19.53/16.30=1.20. (C) Bright pixels of fat tissue in the MR images were colored in red (darker color in the black and white version) using pseudocoloring technique (threshold technique). The percentage of the red pixel area in the white circle was calculated (14.21%).
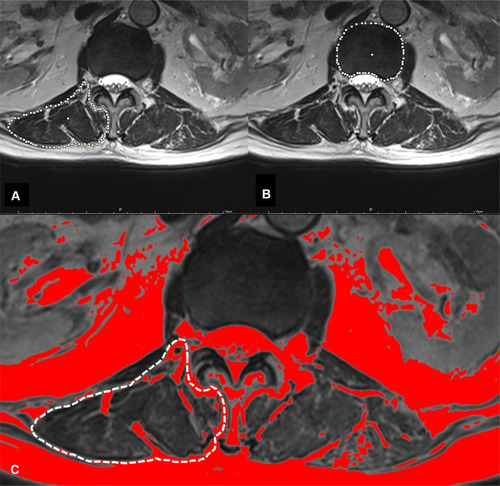
Table 1 Comparisons of Demographic Data Between Group D and Group ND
Table 2 Comparisons of Radiographic Assessments Between Group D and Group ND
Table 3 The Correlations Between the Selected Radiologic Parameters and ODI Score in the Whole Cohort
Table 4 Linear Regression Analysis for ODI with Percentage of Fat Infiltrated and SVA
Figure 2 Scatterplots for the relationships of ODI with percentage of fat infiltrated and SVA. In the whole cohort of patients with degenerative lumbar disorders, ODI was strongly correlated with the percentage of fat infiltrated (A) and SVA (B). The association between SVA and quality-of-life depends on the quality of paravertebral muscle. ODI was moderately correlated with SVA in patients with major fat infiltration (>33%) of lumbar muscle (C), while not correlated with SVA in patients with moderate or minor fat infiltration (≤33%) of lumbar muscle (D).
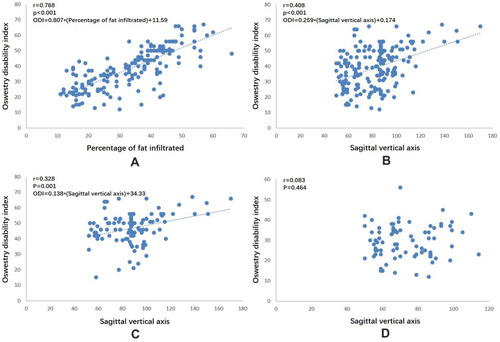
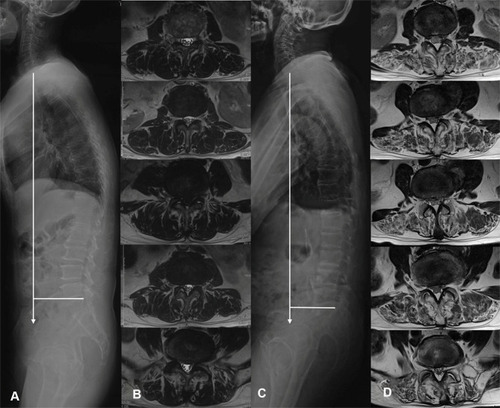
Figure 3 A 68-year-old male with an SVA of 88.5mm (A) and a mean percentage of lumbar muscle fat infiltration of 16.3% (B). His ODI score was 24%. Another 66-year-old male with an SVA of 75.7 mm (C) and a mean percentage of lumbar muscle fat infiltration of 48.4% (D). His ODI score was 46%.