Figures & data
Table 1 MCI Studies Variable Assignment
Table 2 Single Factor Analysis of the Influence of Lifestyle on MCI
Table 3 Binary Logistic Regression Analysis of the Influence of Lifestyle on MCI
Figure 1 Decision tree model of the influence of lifestyles on MCI. This tree is generated by the software through 10 cross-validations. Each box is numbered sequentially. The blue icon represents MCI, and the red icon represents NC. Each box has its own percentage and specific number of examples. Below each box is the influence factor of the next classification; at the top of each box is the corresponding category of influence factor.
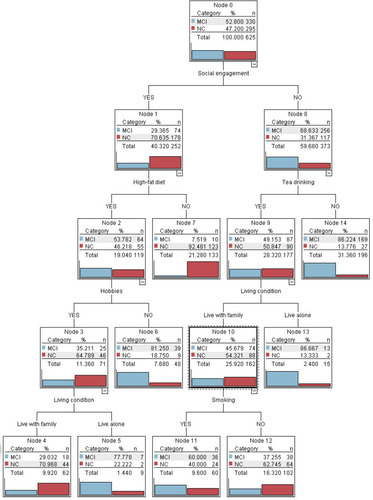
Figure 2 Importance of predictive variables in decision tree model. This figure shows the importance of each influence factor to the result prediction in the decision tree model. As a root node variable, social engagement is the most important predictive variable.
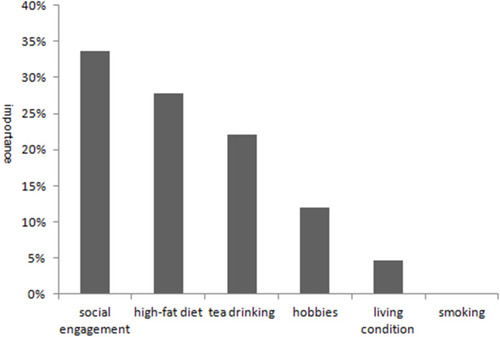
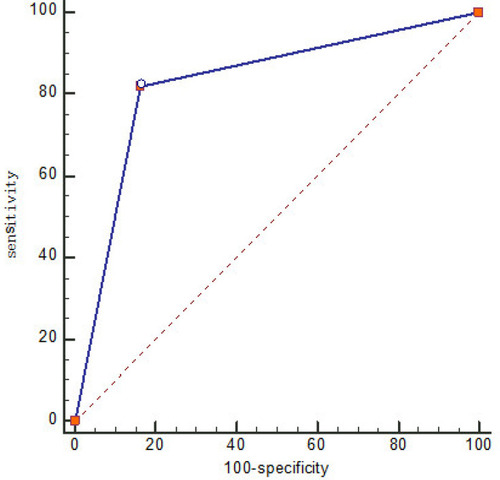
Figure 3 ROC curve of MCI occurrence predicted by decision tree model. The broken line in the figure represents the ability of the decision tree model to predict the occurrence of MCI. The AUC was 0.827, P < 0.001.