
Figures & data
Table 1 The Odds Radio of Variables Over a Five-Year Time Interval
Table 2 Comparison of the Variables Over a Five-Year Time Interval
Table 3 Comparison of the Average Values from Measurements Performed Over a Five-Year Time Interval
Figure 1 Model of changes in body mass index (BMI) including sex and age group in the five-year observation of the subjects.
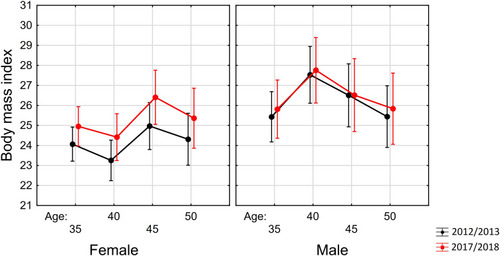
Figure 2 Model of changes in mean total cholesterol concentration (TC) including sex and age group in the five-year observation of the subjects.
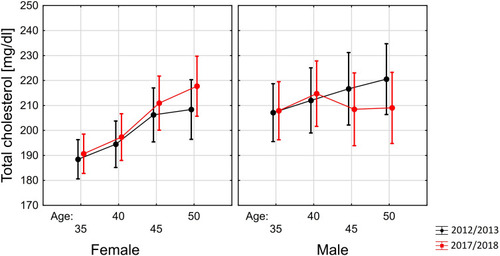
Table 4 Changes in the Selected Factors with Regard to Sex Over a Five-Year Observation Period