Figures & data
Table 1 Characteristics of the sample (percent by leisure-time physical activity)
Figure 1 Mean short mental state examination (SMSE) score by physical activity and apolipoprotein E genotype (age 60 to 69 years).
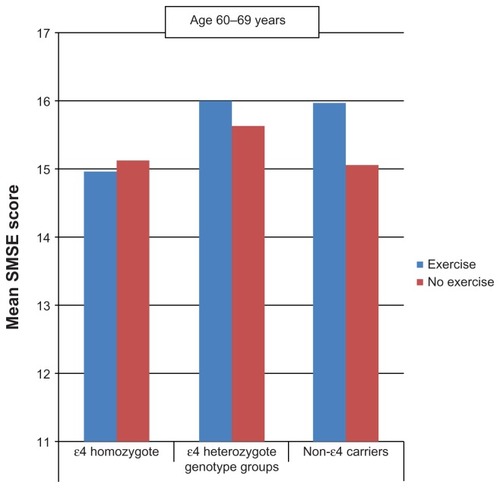
Figure 2 Mean short mental state examination (SMSE) score by leisure-time physical activity and apolipoprotein E genotype (age ≥ 70 years).
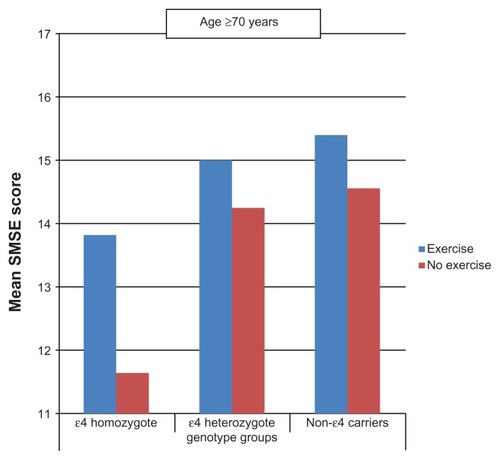
Table 2 Regression analysis dependent variable: short mental state examination (age 60–69 years)
Table 3 Regression analysis dependent variable: short mental state examination (age ≥ 70 years)