Figures & data
Table 1 “Normal” age groups by gender
Table 2 Composition of the pathology groups (MCI and AD) according to gender and age group
Figure 1 Learning performance on (A) healthy elders, (B) MCI individuals, and (C) AD patients. The mean number of words correctly recalled (y-axis) is plotted as a function of the trial (1–7 in the x-axis), for each age group. The first trial is considered as the baseline, whereas trials 2–5 are the training phase, and trial 6 is considered the post-test; the 7th trial is a delayed trial performed (see the text).
Abbreviations: MCI, mild cognitive impairment; AD, Alzheimer’s disease.
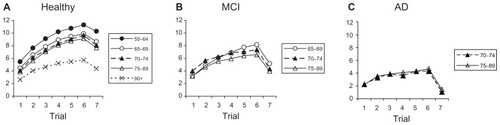
Table 3 Learning comparison in gain score (Trial 6–Trial 1) and delayed scores (Trial 6–Trial 7), t-test