
Figures & data
Figure 1 Flow chart of the enrollment of participants in the study.
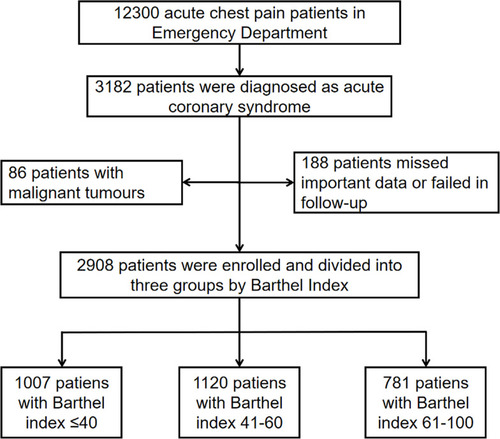
Table 1 Relationships Between Baseline Clinical Characteristics and Barthel Index in Patients with Acute Coronary Syndrome
Figure 2 Scatter plot of GRACE score and BI (A); Gensini score and BI (B).
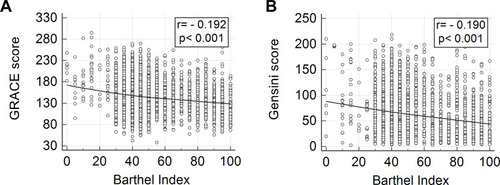
Table 2 In-Hospital and Long-Term Adverse Outcome of Patients Categorized by Barthel Index
Figure 3 Kaplan–Meier survival curve of all-cause death for NST-ACS patients (A), cardiac death for NST-ACS patients (B), all-cause death for STEMI patients (C) and cardiac death for STEMI patients (D) by Barthel index score.
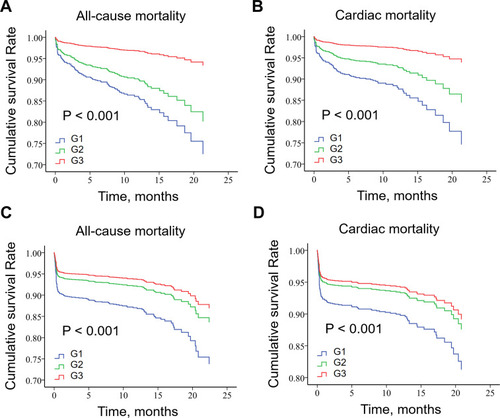
Figure 4 ROC curves for GRACE score, Gensini score and BI in relation to all-cause mortality (A) and cardiac mortality (B).
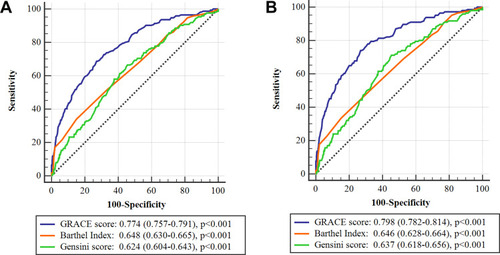
Table 3 Cox Regression Analysis Regarding Correlations Between All-Cause Mortality and Barthel Index
Table 4 Kaplan–Meier Survival Analysis of Mortality in Acute Coronary Syndrome Patients