Figures & data
Table 1 Patients Characteristics in RNA Sequencing
Table 2 Top 10 Up- and Down-Regulated DEGs in Male Osteoporosis
Table 3 Top 10 Up- and Down-Regulated DElncRNAs in Male Osteoporosis
Figure 1 The heat-maps of top 50 up- and down-regulated DEGs and DElncRNAs in male osteoporosis. (A) the heat-map of top 50 up- and down-regulated DEGs in male osteoporosis. Row and column were used to represent DEGs and samples, respectively. The color scale was used to represent the expression levels of DEGs. (B) the heat-maps of top 50 up- and down-regulated DElncRNAs in male osteoporosis compared to normal control. Row and column were used to represent DElncRNAs and samples, respectively. The color scale was used to represent the expression levels of DElncRNAs.
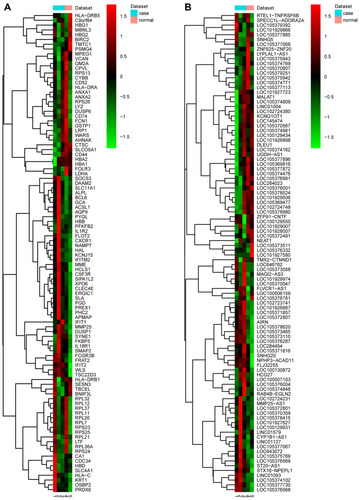
Figure 2 The male osteoporosis-specific PPI network. The PPI network was consisted of 101 nodes and 105 edges. Ellipses (nodes) were the proteins encoded by DEGs and ellipses with black border represented the proteins encoded by DEGs which belonged to the top 10 up- and down-regulated DEGs in male osteoporosis. Red and blue colors were used to represent up- and down-regulation in male osteoporosis, respectively.
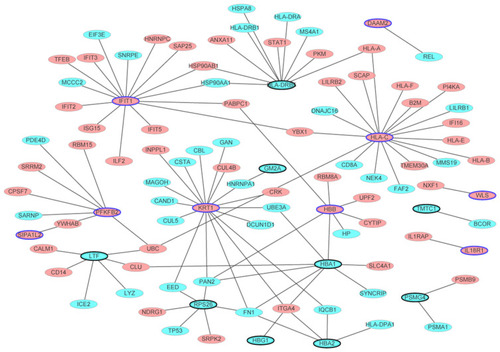
Figure 3 The DElncRNAs-nearby targeted DEGs interaction network in male osteoporosis. The DElncRNAs-nearby targeted DEGs interaction network was consisted of 278 nodes and 168 edges. Ellipses and rhombuses were used to represent the DEGs and DElncRNAs in male osteoporosis, respectively. Red and blue colors were used to represent up- and down-regulation in male osteoporosis, respectively.
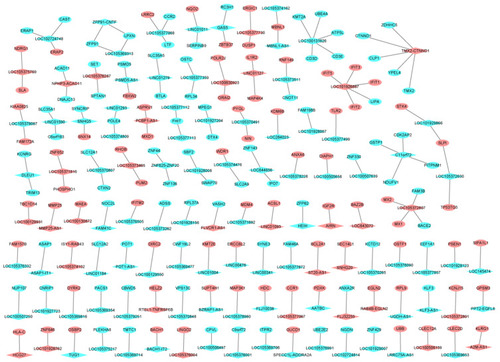
Figure 4 Functional annotation of all DEGs in male osteoporosis. (A) top 15 most significantly enriched biological process; (B) top 15 most significantly enriched cellular components; (C) top 15 most significantly enriched molecular functions; (D) top 15 most significantly enriched KEGG pathways. The x-axis shows -log FDR and y-axis shows the terms of GO/KEGG terms.
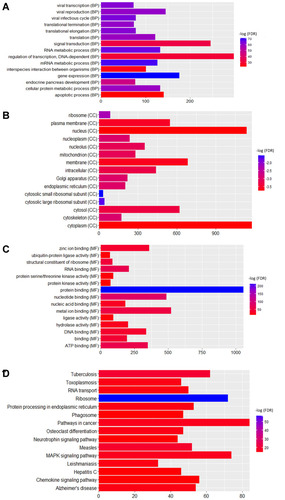
Figure 5 Pathway of osteoclast differentiation that enriched in DEGs in male osteoporosis. The red and green rectangles were represented the particles which regulated by the up- and down-regulated DEGs in male osteoporosis, respectively.
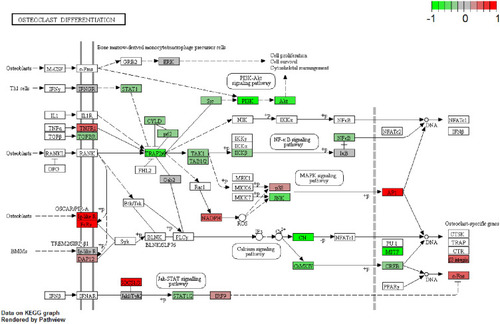
Figure 6 Functional annotations of nearby targeted DEGs of DElncRNAs in male osteoporosis. (A) top 15 most significantly enriched biological process; (B) top 15 most significantly enriched cellular components; (C) top 15 most significantly enriched molecular functions. The x-axis shows -log FDR and y-axis shows the terms of GO/KEGG terms.
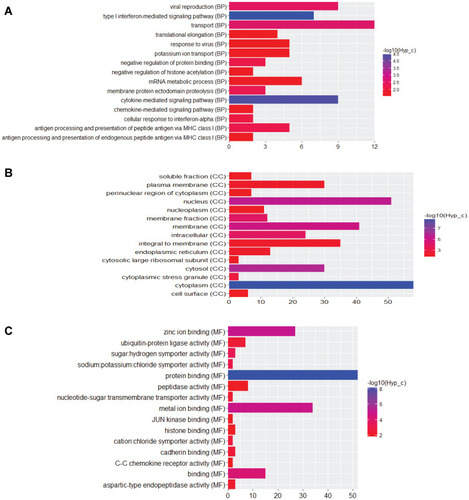
Figure 7 The DElncRNAs-nearby targeted DEGs interaction network in male osteoporosis. The DElncRNAs-nearby targeted DEGs interaction network was consisted of 26 nodes and 22 edges. Ellipses and rhombuses were used to represent the DEGs and DElncRNAs in male osteoporosis, respectively. Ellipses with black or blue border represented the DEGs which belonged to the top 10 up- and down-regulated DEGs in male osteoporosis compared to normal control. Red and blue colors were used to represent up- and down-regulation in male osteoporosis, respectively.
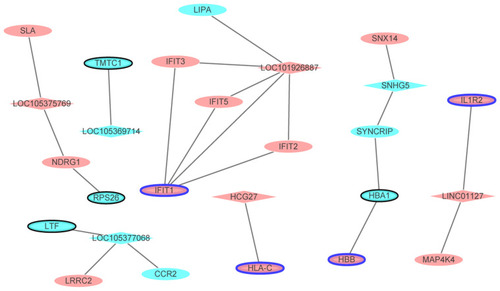
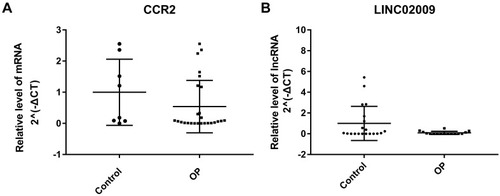
Figure 8 QRT-PCR verification results. The X-axis was indicated different samples and the Y-axis was indicated the relative level of CCR2 mRNA (A) and LINC02009 lncRNA (B) for qRT-PCR results.