Figures & data
Table 1 Baseline Characteristics
Figure 1 Screened and Included Patients.
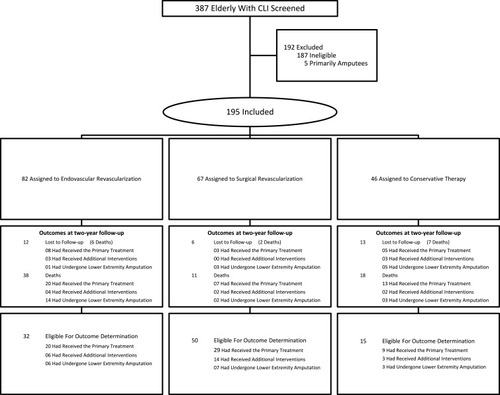
Figure 2 Quality of Life. Data is presented as mean and standard deviation. *Significant difference between the treatment group and the surgical treatment group (p<0.05). **Significant difference in the treatment group between this measurement and baseline (p<0.05).
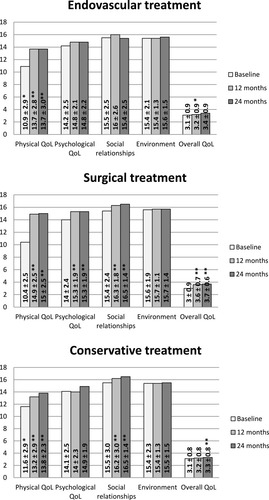
Table 2 WHOQOL-BREF Compared to Normal Values for Elderly
Figure 3 Health status (SF-12). Data is presented as mean and standard deviation. *Significant difference between the treatment group and the surgical treatment group (p<0.05). **Significant difference in the treatment group between this measurement and baseline (p<0.05). ***Significant difference in the treatment group between this measurement and the 12-month measurement (p<0.05).
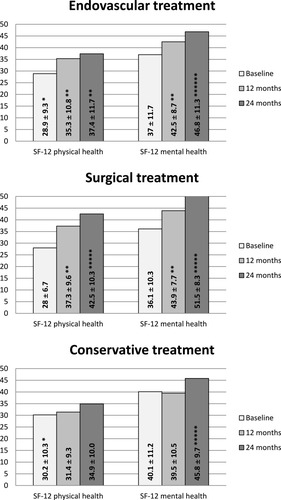
Table 3 HS Compared to Normal Values for Elderly
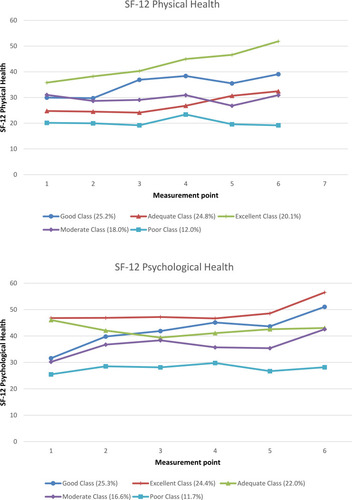
Figure 4 Quality of Life Trajectories.
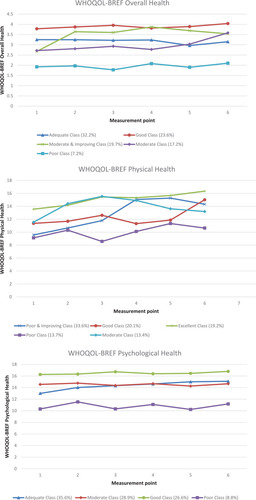
Figure 5 Health Status Trajectories.