Figures & data
Figure 1 Subcortical nuclei abnormalities between the ACS patients and controls.
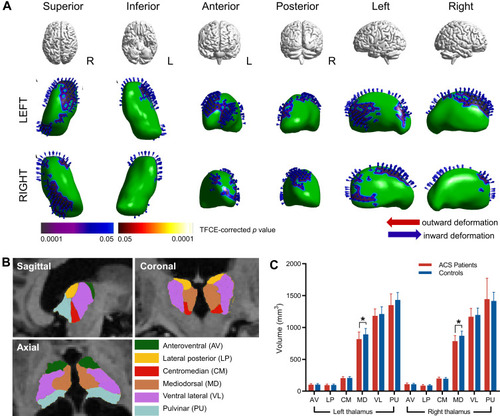
Table 1 Baseline Characteristics and Cognitive Assessment Scores of Subjects with or Without ACS
Table 2 Global Measurements and Subcortical Nuclei Volumes in ACS Patients and Controls at Baseline
Table 3 Correlations of Morphometric Abnormalities with Clinical Variables, Cognitive Scores, and Carotid Variables in ACS Patients and Controls
Table 4 Volumes of Thalamic Subregions in ACS Patients and Controls at Baseline
Figure 2 Mediation analysis for associations among carotid stenosis, lipid/metabolic variables, thalamic volume, and cognition at baseline.
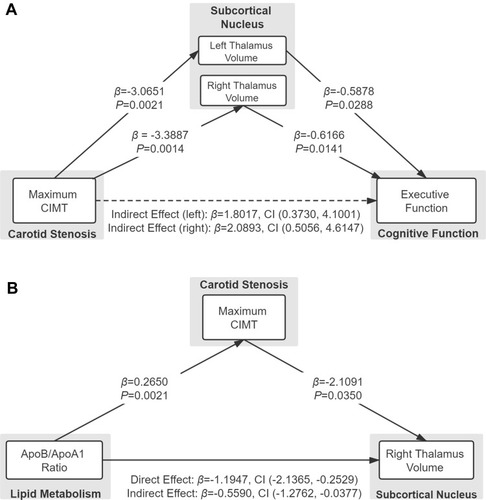
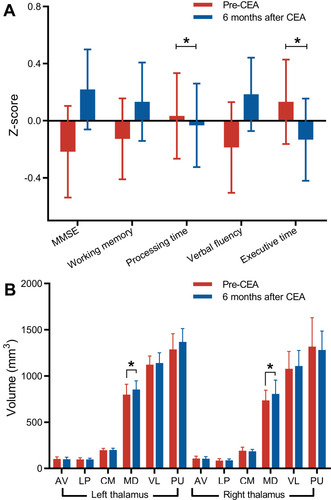
Figure 3 The changes in cognitive assessment scores and thalamic subfield volumes in ACS patients 6 months after CEA.