Figures & data
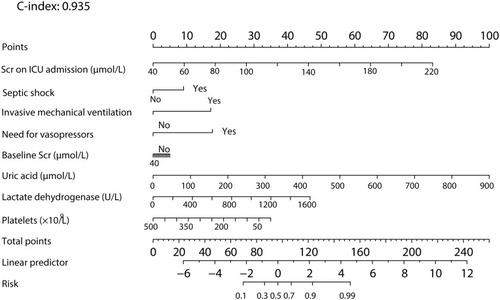
Figure 1 Flowchart of the patient inclusion and exclusion process.
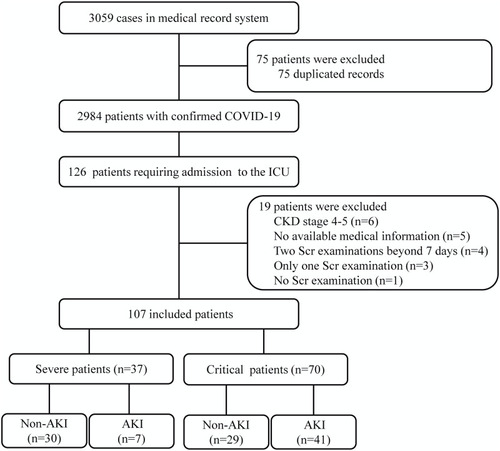
Table 1 Comparisons of the Clinical Characteristics of Patients in ICU with Different Severities of Coronavirus Disease 2019
Table 2 Complications, Treatments and Outcomes of Patients Between AKI and Non-AKI with Different Severities of Coronavirus Disease 2019
Table 3 Univariable and Multivariable Logistic Regression Analyses for In-Hospital Mortality with Coronavirus Disease 2019
Figure 2 Kaplan–Meier survival curves for patients with severe to critical COVID-19 with and without AKI during the time from hospital admission (Log rank test P < 0.001).
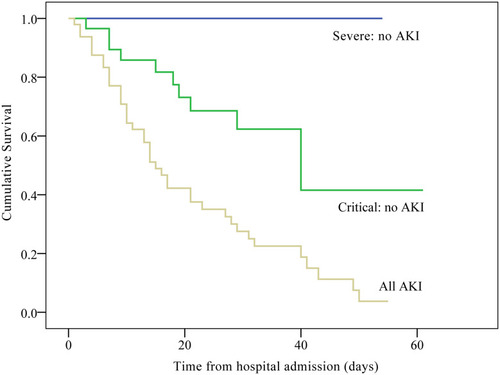
Figure 3 Prediction nomogram for predicting the AKI onset probability of patients with coronavirus disease 2019. Prediction of the patient’s value is located on each variable axis, and a line is drawn upward to determine the number of nomogram points for predicting the AKI probability of patients with COVID-19. The sum of these numbers is located on the total points axis, and a line is drawn downward to the predicted axes to determine the likelihood of AKI (C-index: 0.935; 95% CI, 0.892–0.978).