Figures & data
Table 1 Linear Regression Analysis Predicting Chronological Age From the Parameters of Short Physical Performance Battery in Development Cohort (n=717)
Figure 1 Distributions of short physical performance battery (SPPB) total score and balance score, walking speed score, chair rise score in development cohort (n=717).
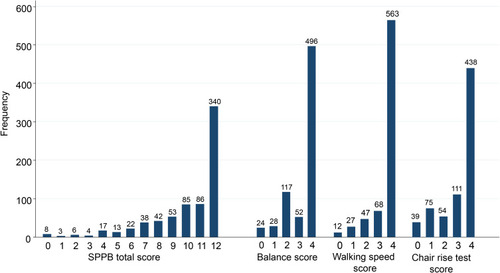
Figure 2 Scatterplot and fitted line by linear regression analysis showing (A) functional age and chronological age in development cohort (n=717) and (B) functional age and frailty index in validation cohort (n=117).
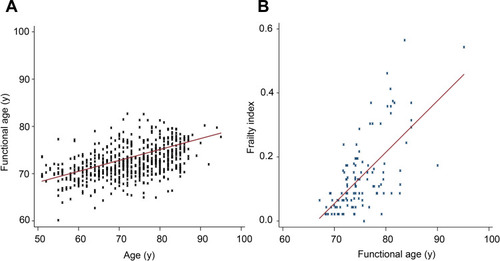
Table 2 Clinical Characteristics of Patients Included in the Validation Cohort, with Higher Functional Age and Lower Functional Age Group Defined by the Median Value of Functional Age (74.2 Years)
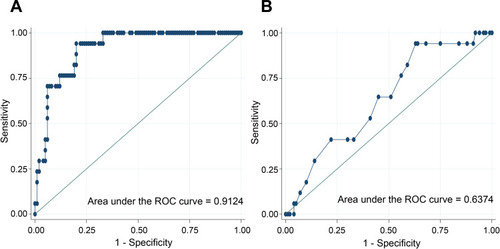
Figure 3 Receiver of characteristic (ROC) curves showing diagnostic performance of (A) functional age and (B) chronological age to detect frail status by frailty index in validation cohort (n=117).