Figures & data
Figure 1 Hemorrhagic infarction and parenchymal hemorrhage CT scan examples of hemorrhagic infarction (HI) and parenchymal hemorrhage (PH), according to the European Cooperative Acute Stroke Study II classificationCitation28.
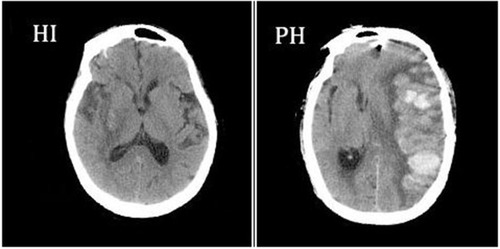
Table 1 Baseline Characteristics of the AIS Patients with and without HT
Table 2 Baseline Characteristics of the Patients by Quartile of the Stress Hyperglycemia Ratio
Table 3 Baseline Characteristics of the Patients According to the Subcategorized Groups of HT in Total Population
Table 4 Baseline Characteristics of the Patients According to the Subcategorized Groups of HT in Non-Diabetic Population and Diabetic Population
Figure 2 (A) The level of SHR in the subcategorized groups of HT in total population; (B) The level of SHR in the subcategorized groups of HT in non-diabetic population; (C) The level of SHR in the subcategorized groups of HT in diabetic population.
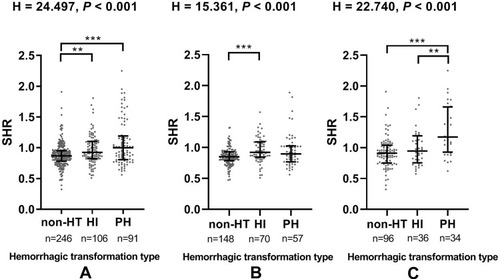
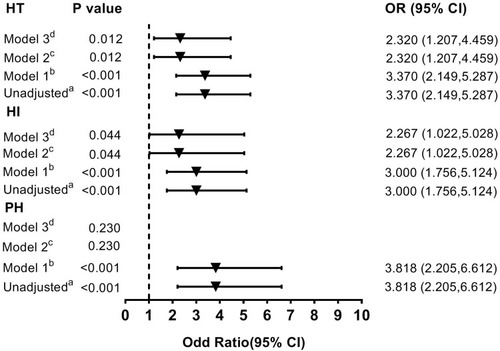
Figure 3 Multivariate adjusted odds ratios for the association between the highest quartile of SHR and the subcategorized groups of HT (including HT, HI and PH respectively). aReference OR (1.000) is the SHR Q1-3 group. bModel 1: adjusted for age, sex. cModel 2: adjusted for covariates from Model 1 and further adjusted for vascular risk factors (history of hypertension, atrial fibrillation, diabetes, dyslipidemia, current smoking and current alcohol drinking) and systolic blood pressure, stroke mechanism, baseline NIHSS score, baseline white cells counts, platelets, fibrinogen, creatinine and the therapy of anticoagulant, antiplatelet and lipid-lowering. dModel 3: adjusted for covariates from Model 2 and further adjusted for glucose levels.