
Figures & data
Figure 1 Contrast-induced encephalopathy in brain computed tomography (CT) scans. (A) Emergency brain CT showed no acute pathological findings. (B) Brain CT 2 hours after surgery indicated multiple high-density regions in the subarachnoid space. (C) Brain CT 10 hours after surgery showed significantly swollen brain tissue, particularly in the right hemisphere, the left frontal lobe, and the left occipital lobe. The high-density shading in the subarachnoid cavity was significantly denser than in previous scans. (D) Brain CT 72 hours after surgery showed the sulci of the right hemisphere became shallow, and low-density shadows could be seen in the frontal parietal lobe. But cerebral edema was significantly improved.

Figure 2 Computed tomography angiography (CTA) showed no evidence of macrovascular embolism in (A) posteroanterior (PA), (B) posterior (P) and (C) left anterior oblique (LAO) view.
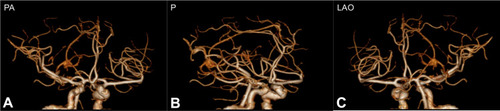
Figure 3 Brain magnetic resonance imaging (MRI) 2 hours after surgery showed hyperintense areas in the right cortex in (A) T2-weighted image and (B) fluid-attenuated inversion recovery (FLAIR) images, and no clear signs of subarachnoid hemorrhage were observed on (C) diffusion-weighted imaging (DWI).
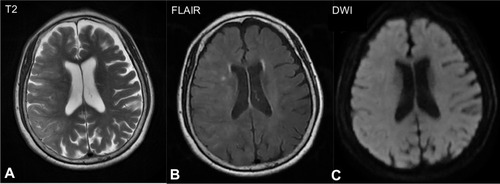
Table 1 Cases of CIE Following Cardiac Catheterization with Non-Ionic, Low-Osmolar Contrast Agents from 1970-Present