Figures & data
Table 1 Statistics and Further Screened of the Two Microarray Databases Derived from the GEO Database
Table 2 Reclassifying Two Gene Expression Profiles Based on Infarct Time
Table 3 Number of Differential Genes in Different Infarct Groups
Figure 1 Venn diagram of DEGs and protein–protein interaction network. (A) Upregulated genes of DEGs common to all three infarct groups. (B) Downregulated genes of DEGs common to all three infarct groups. (C) Protein–protein interaction network constituted with the DEGs.
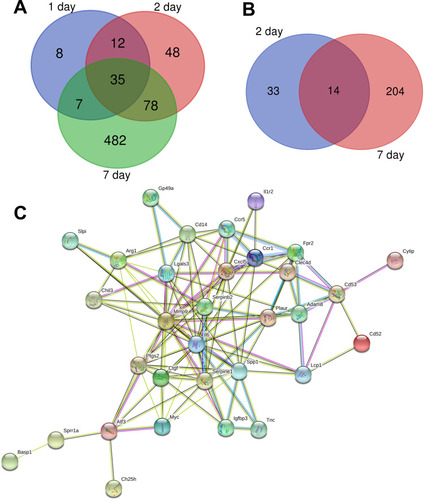
Table 4 GO and KEGG Pathway Enrichment Analysis of DEGs
Table 5 Top 10 Core Genes with Higher Degrees of Connectivity
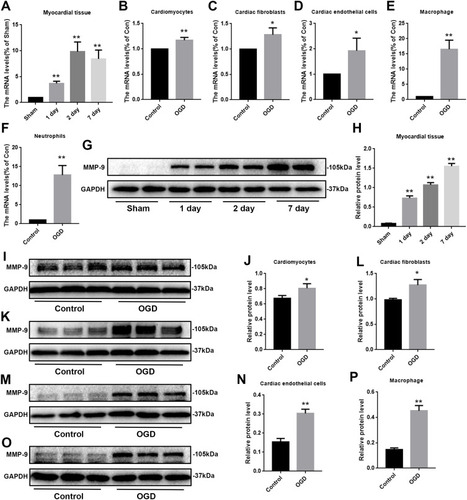
Figure 2 mRNA and protein expression levels in vivo and in vitro models. (A) The mRNA expression of MMP-9 within the myocardial infarction tissue, (n=3). (B–F) The mRNA expression of MMP-9 within the cardiomyocytes, fibroblasts, endothelial cells, macrophage and neutrophils, (n=3). (G, H) The protein expression of MMP-9 within the myocardial infarction tissue, (n=4). (I, J) The protein expression of MMP-9 within the cardiomyocytes, (n=3). (K, L) The protein expression of MMP-9 within the fibroblasts, (n=3). (M, N) The protein expression of MMP-9 within the endothelial cells, (n=3). (O, P) The protein expression of MMP-9 within the macrophage, (n=3). Data are means ± SDs, *P < 0.05; **P < 0.01.