
Figures & data
Figure 1 Participant flow through the study.
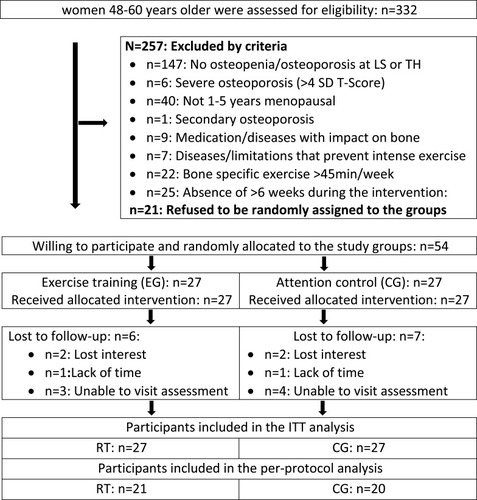
Table 1 Baseline Characteristics of the ACTLIFE-RCT Study
Table 2 Baseline Data and Changes of BMD at LS and TH in the CG and EG and Corresponding Between Group Differences. *P<0.05
Table 3 Baseline Data and Changes of Anthropometric Parameters in the CG and EG and Corresponding Between Group Differences. *P<0.05; **P<0.01; ***P<0.001
Table 4 Baseline Data and Changes of the Metabolic Syndrome Z-Score in the CG and EG and Corresponding Between Group Differences
Table 5 Baseline Data and Changes of Menopausal Symptoms According to MRS II and Low Back Frequency in the CG and EG and Corresponding Between Group Differences. **P<0.01
Table 6 Baseline Data and Changes of Maximum Hip/Leg Extension Strength and Maximum Jumping Height in the CG and EG and Corresponding Between Group Differences. *** P<0.001