Figures & data
Table 1 Characteristics of patients in the frail group
Figure 1 Representation of the subject position. (A) Position before the go-signal (initial position). (B) Position at the end of the hand movement.
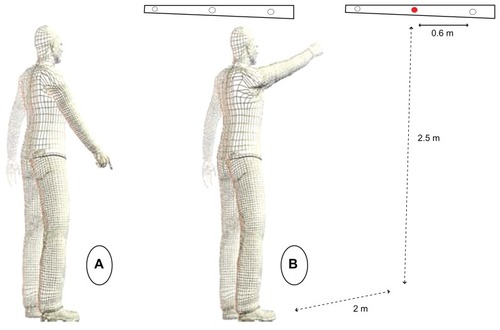
Figure 2 Typical data for two representative subjects (left, control group; and right, frail group) for three trials in the choice reaction time condition. Upper panel: CoP displacement in the medio-lateral axis (X) and antero-posterior axis (Y). Middle panel: CoP velocity profiles. Lower panel: hand velocity profiles. Horizontal axis represents time; acquisition duration is divided into four phases: baseline (−600 ms to −150 ms); APA phase (−150 ms to t0); IP (t0 to 100 ms); and FP (between the hand deceleration beginning to the hand movement offset).
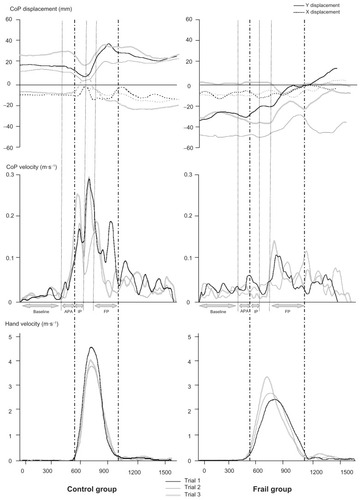
Table 2 Hand and CoP kinematics in the control group and the frail group for the SRT and the CRT conditions
Figure 3 NTPVHand and NTMVCoP with respect to hand movement time, in the two groups and for the SRT and the CRT conditions.
Abbreviations: APA, anticipatory postural adjustment; CoP, center of pressure; CRT, choice reaction time; NTMVCoP, CoP normalized time to maximal velocity; NTPVHand, hand normalized time to peak velocity; SRT, simple reaction time.
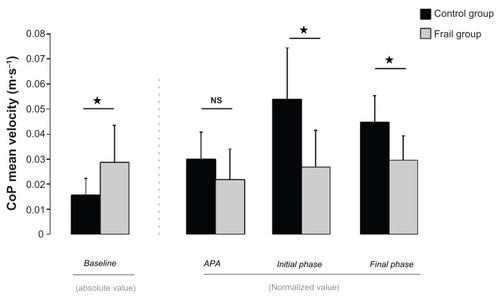
Figure 4 CoP mean velocity during the baseline absolute values (left panel). CoP mean velocity during the APA, initial and final intervals, normalized values (right panel) in the CG and the FG.
Abbreviations: APA, anticipatory postural adjustment; CG, control group; CoP, center of pressure; CRT, choice reaction time; FG, frail group; NTMVCoP, CoP normalized time to maximal velocity; NTMVHand, hand normalized time to maximal velocity.
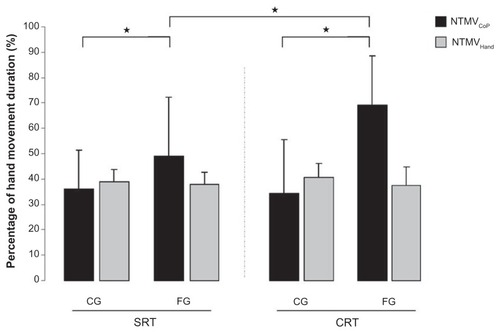
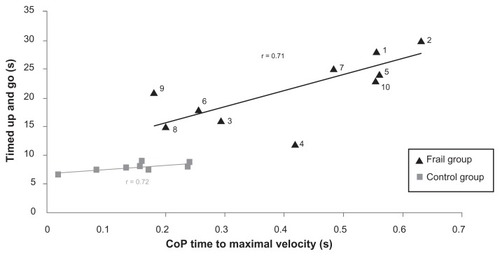
Figure 5 Relationship between timed up-and-go scores and CoP time to maximal velocity in the control group (gray square) and the frail group (black triangle).