Figures & data
Table 1 The Clinical Characteristics of Elderly Patients T3-T4 Laryngeal Cancer Before and After Propensity Score Matching
Figure 1 Kaplan–Meier curves of OS and CSS according to whether or not LND has been done for patients with T3-T4 laryngeal cancer. (A and B) the OS of patients before and after PSM. (C and D) the CSS of patients before and after PSM.
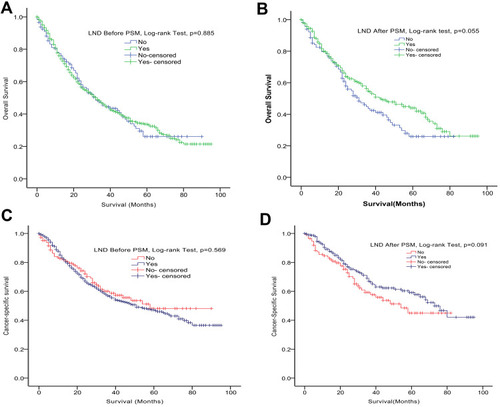
Figure 2 Competing risk curve of CSS among elderly patients with T3-T4 laryngeal cancer: before PSM (A) and after PSM (B).
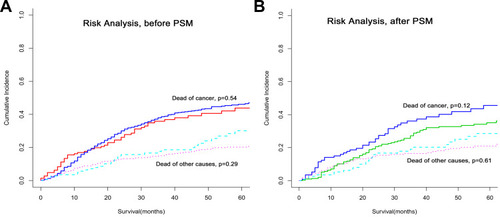
Figure 3 Kaplan–Meier curves of OS (A) and CSS (B) according to whether or not lymph node metastasis has.
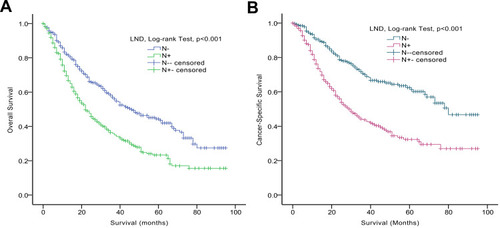
Table 2 Multivariable Cox Regression of Risk Factors for Lymph Node Metastasis Among Patients Who Underwent Lymph Node Dissection
Figure 4 The nomogram for the preoperative prediction of lymph node metastases (A). Calibration curves of the nomogram in the training set (B) and validation set (C). Plots (D and E) show the receiver–operator characteristic (AUC) curves of the nomogram in the training and validation sets, respectively.
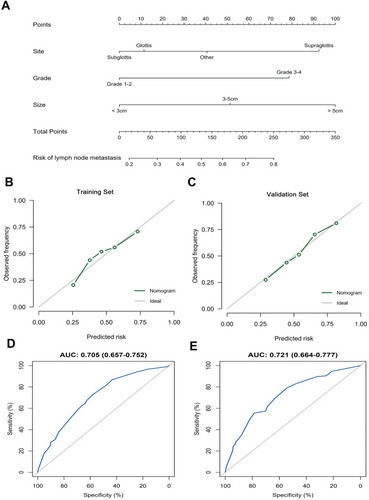
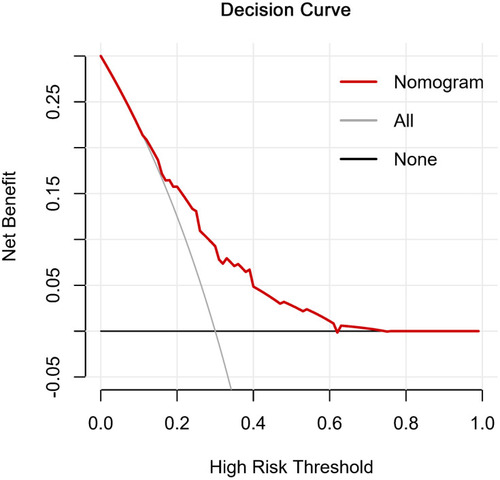
Figure 5 Decision curve analysis for the prediction nomogram.