
Figures & data
Figure 1 Study Flow Diagram Illustrating the Process of Screening and Selecting Patients and Caregivers.
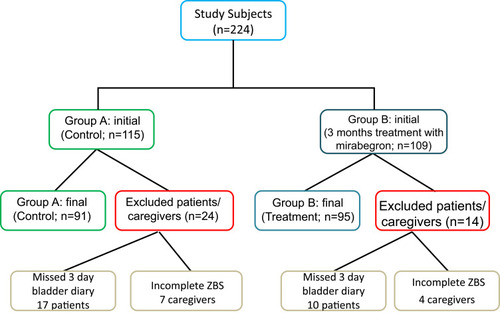
Table 1 Demographic Parameters and Baseline Characteristics of Participants (P<0.05)
Table 2 Urinary Parameters of the Older Female Patients (P<0.05)
Table 3 Distribution of the Individual Scales and the Overall ZBS Total Score in Observation Group A (P<0.05)
Table 4 Comparison of Pre-Treatment and Post-Treatment ZBS in Group B (P<0.05)
Table 5 Correlation Between Improvements (%) in Incontinence Parameters and ZBS Domains and Total Score (P<0.05)