Figures & data
Table 1 All Differentially Expressed miRNAs in Osteonecrosis of the Femoral Head
Table 2 Top 20 Differentially Expressed mRNAs in Osteonecrosis of the Femoral Head
Figure 1 The volcano plot and heat map of all differentially expressed miRNAs in osteonecrosis of the femoral head. (A) The volcano plot of all differentially expressed miRNAs. The X and Y axis represents Log2 Fold Change and –log10 FDR, respectively. Blue and red represents up-regulated and down-regulated miRNAs, respectively. (B) The heat map of all differentially expressed miRNAs.
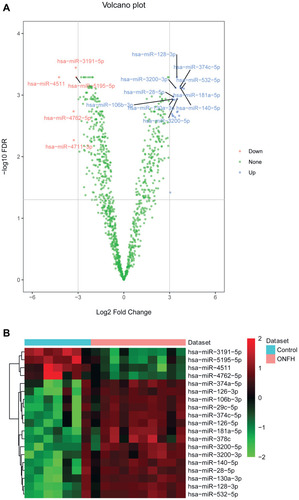
Figure 2 The volcano plot and heat map of the top 100 differentially expressed mRNAs in osteonecrosis of the femoral head. (A) The volcano plot of the top 100 differentially expressed mRNAs. The X- and Y-axes represent Log2 Fold Change and –log10 FDR, respectively. Blue and red represent up-regulated and down-regulated mRNAs, respectively. (B) The heat map of the top 100 differentially expressed mRNAs.
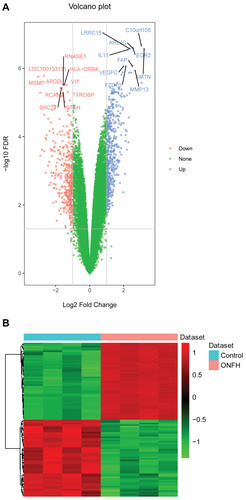
Figure 3 The network of miRNA-target mRNAs between 24 miRNAs and 457 mRNAs in osteonecrosis of the femoral head. The triangle and circule represent the differentially expressed miRNAs and targeted differentially expressed mRNAs, respectively. The red and green color represent up-regulation and down-regulation, respectively.
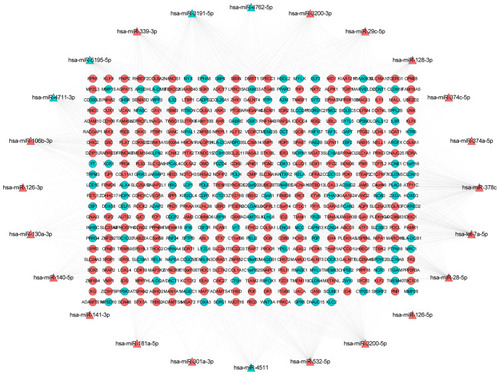
Figure 4 The sub-network of miRNA-target mRNAs between hsa-miR-378c, hsa-let-7a-5p, hsa-miR-28-5p, hsa-miR-3200-5p, hsa-miR-532-5p, and their targeted mRNAs in osteonecrosis of the femoral head. The triangle and circule represent the differentially expressed miRNAs and targeted differentially expressed mRNAs, respectively. The red and green color represent up-regulation and down-regulation, respectively.
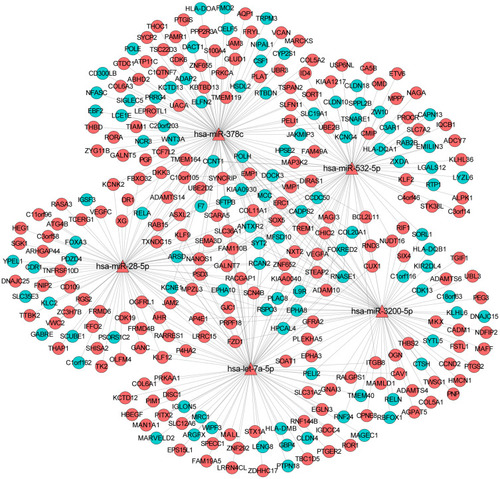
Table 3 Total KEGG Terms Involved Targeted Differentially Expressed mRNAs in Osteonecrosis of the Femoral Head
Figure 5 Top five significantly enriched GO terms of targeted differentially expressed mRNAs in osteonecrosis of the femoral head. The z-score clustering in the GO terms of targeted differentially expressed mRNA is shown below. The red and blue color represent up-regulated and down-regulated mRNA, respectively.
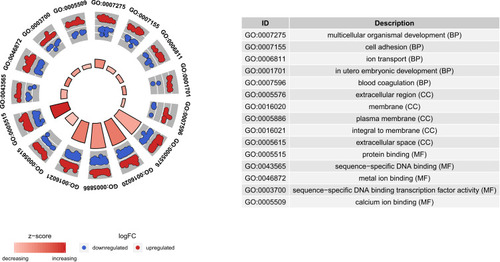
Figure 6 KEGG signaling pathways of targeted differentially expressed mRNAs in osteonecrosis of the femoral head. Different colors represent different signaling pathways; mRNA outside the circle represents the enriched one of mRNAs in the particular signaling pathway.
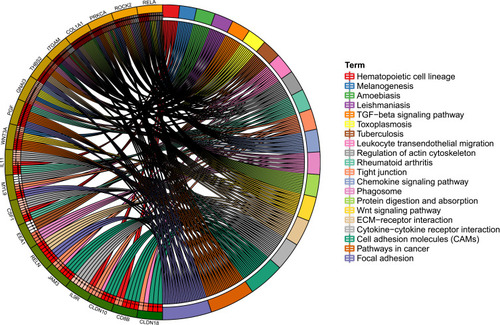
Table 4 Clinical Information of Enrolled Individuals in vitro Validation
Figure 7 The in vitro validation of differentially expressed miRNAs and targeted differentially expressed mRNAs. Fold change >1 and fold change <1 represent up-regulation and down-regulation, respectively. *P<0.05.
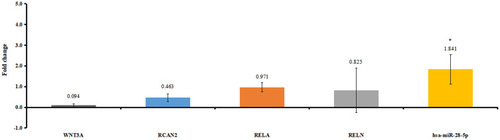
Figure 8 Expression box plots of CLDN10, CLDN18, CSF1, DACT1, IL9R, RCAN2, RELN, and WNT3A in the GSE123568 dataset. *P<0.05, **P<0.01.
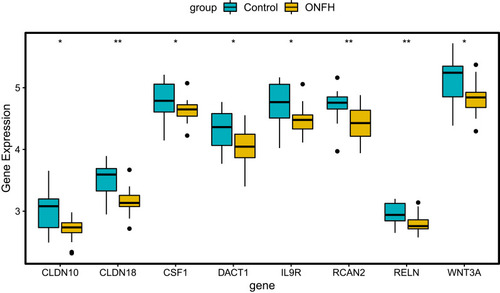
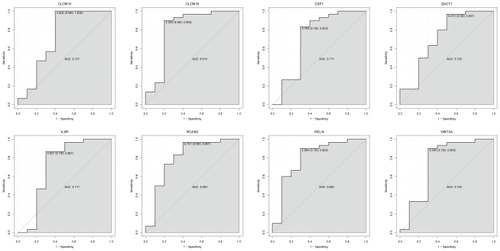
Figure 9 The ROC curves of CLDN10, CLDN18, CSF1, DACT1, IL9R, RCAN2, RELN, and WNT3A between osteonecrosis of the femoral head and normal controls. The ROC curves were used to show the diagnostic ability of these mRNAs with 1-specificity and sensitivity.