
Figures & data
Table 1 Socio-Demographic and Health Characteristics of the Study Sample by Sex
Table 2 Descriptive Statistics of Anthropometry, Body Composition and Physical Performance of the Study Sample by Sex
Figure 1 Classification by stages of sarcopenia and sex.
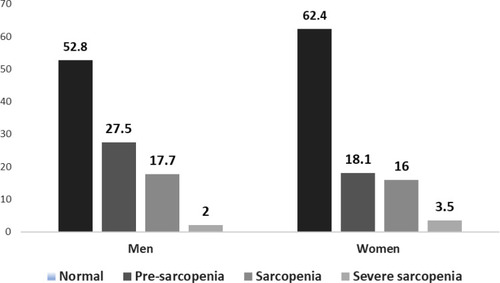
Figure 2 Kaplan-Meier survival estimates by stages of sarcopenia and sex.
Notes: Log rank test for equality of survivor functions. (A) Men: chi2(1) = 19.91; p < 0.0001. (B) Women: chi2(1) = 47.15; p <0.0001
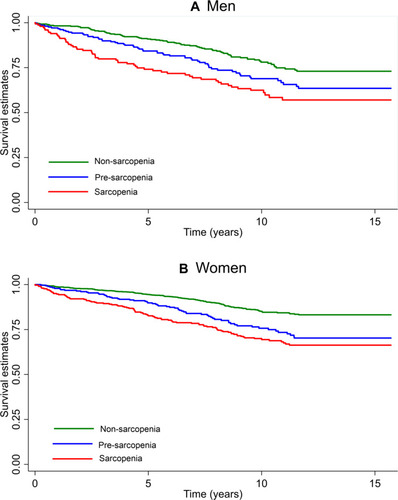
Table 3 Proportional Hazard Models for 15y Mortality Risk According to Sarcopenia