Figures & data
Figure 1 The flow chart of participants screening, including, grouping, examination and analyses in this study.
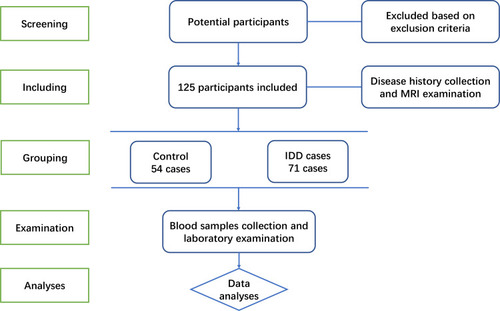
Table 1 Baseline Characteristics of the Included Participants in This Study
Figure 2 Decreased plasma melatonin in IDD cases. (A) A significantly decreased plasma melatonin was detected in the IDD cases in stage 3, 4 and 5. **P<0.01, ***P<0.001. (B) melatonin could be used as a diagnostic biomarker for IDD with an area under curve of 0.808 and P<0.001.
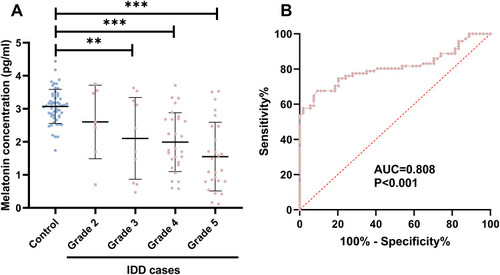
Figure 3 The correlation matrix of the plasma melatonin, clinical characteristic and experiment examinations. (A) The correlation matrix of the plasma melatonin, clinical characteristic and experiment examinations in healthy controls. (B) The correlation matrix of the plasma melatonin, clinical characteristic and experiment examinations in healthy controls. The circle size reflected the Pearson r value. Most red reflected −1 while most blue reflected 1 in the figures.
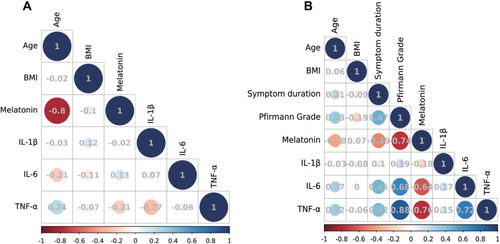
Figure 4 The associations between melatonin and proinflammatory factors. (A) No significant linear association between melatonin and IL-1β level in the IDD cases (R2=0.032, P=0.137). (B) Negative linear correlations between plasma melatonin and IL-6 (R2=0.407, P<0.001). (C) Negative linear correlations between plasma melatonin and TNF-α (R2=0.575, P<0.001). All the analyses were detected using a linear regression analyses model.
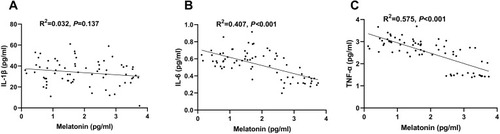
Table 2 Clinical and Experimental Characteristics in IDD Patients in and Above the 1st Quartile of Melatonin Levels
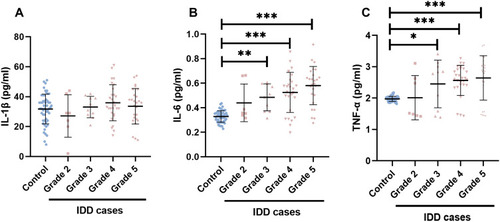
Figure 5 Increased plasma pro-inflammatory factors in the IDD cases. The severity of the IDD cases were determined using the Pfirrmann grade (Grades 2–5). There were 7, 10, 28 and 26 IDD cases in the Pfirrmann grade 2, 3.4 and 5 group. Respectively. (A) The plasma IL-1β between control subjects and IDD cases in different stages. (B) The plasma IL-6 between control subjects and IDD cases in different stages. (C) The plasma TNF-α between control subjects and IDD cases in different stages. *P < 0.05, **P < 0.01, and ***P<0.001.