
Figures & data
Table 1 Clinicopathological Characteristics of 100 Patients Underwent CRS/HIPEC
Table 2 Perioperative Data of 100 Patients Underwent CRS/HIPEC
Figure 1 Changes in the neutrophil count in elderly and non-elderly groups on days 1, 3, and 5 after surgery.
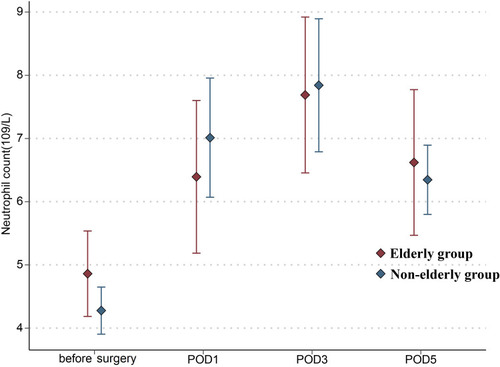
Figure 2 Changes in the platelet level in elderly and non-elderly groups on days 1, 3, and 5 after surgery.
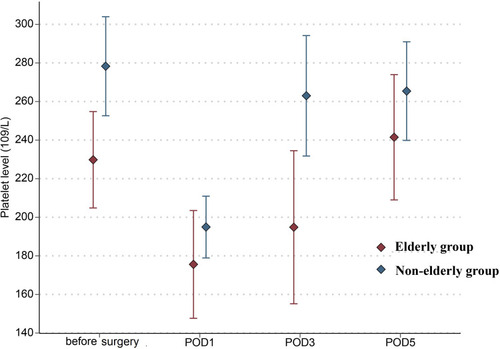
Figure 3 Changes in the ALT level in elderly and non-elderly groups on days 1, 3, and 5 after surgery.
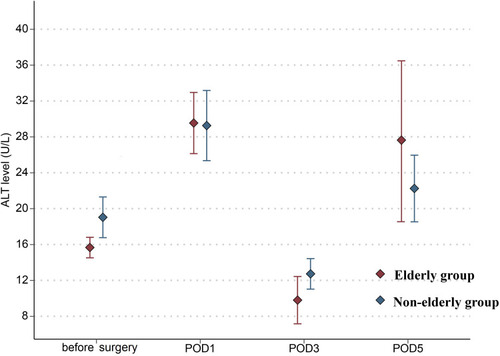
Figure 4 Changes in the creatinine level in elderly and non-elderly groups on days 1, 3, and 5 after surgery.
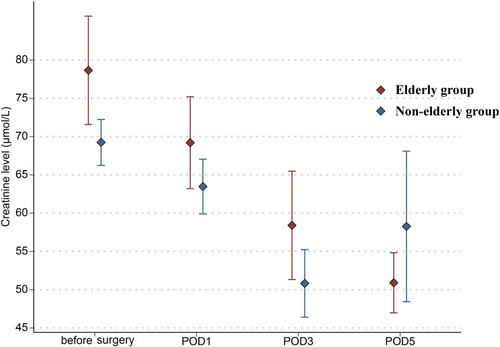
Figure 5 Overall survival curve in entire group.
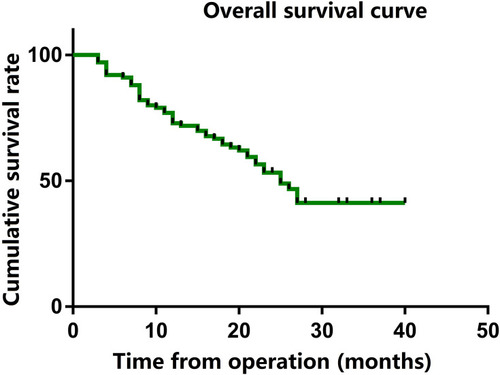
Figure 6 Overall survival curve in two groups.
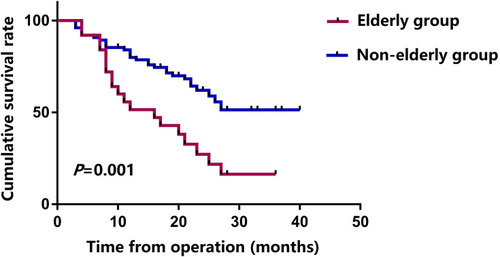
Table 3 Univariate and Multivariate Cox Regression Analysis of Overall Survival in 100 Patients After CRS/HIPEC