Figures & data
Table 1 Biomarker Profiles and Pathological Interpretations
Table 2 Demographic Characteristic and Clinical Data at Baseline
Table 3 Distribution of Cerebrospinal Fluid Biomarker AT(N) Profiles in Groups
Figure 1 Revision of initial diagnosis post-CSF biomarker disclosure based on the AT(N) framework.
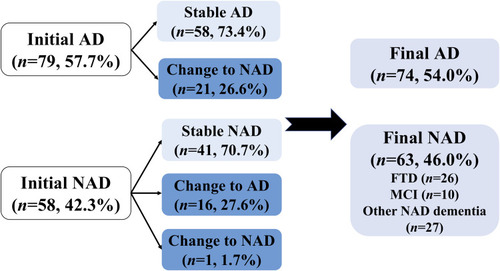
Figure 2 Distribution of cerebrospinal fluid (CSF) biomarker profiles based on the AT(N) framework in different diagnostic groups. (A) Distribution in five diagnostic subgroups: Group Stable AD, Group Change AD to NAD, Group Change NAD to AD, Group Stable NAD, Group Change NAD to NAD; (B) Distribution in Group Final AD; (C) Distribution in Group Final NAD. Notes: Alzheimer’s continuum (orange), Non-AD pathologic changes (yellow), normal AD biomarkers (light green).
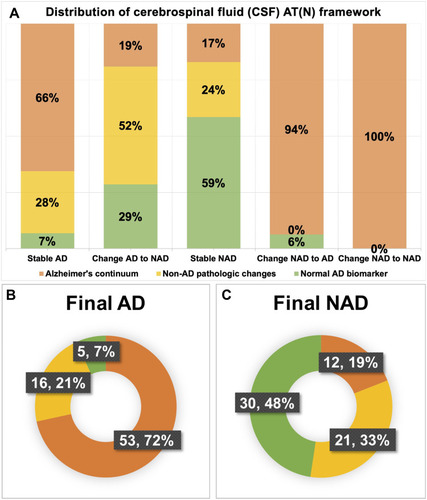
Table 4 Influence of Cerebrospinal Fluid AT(N) Framework on Diagnostic Confidence
Figure 3 Different changes in diagnostic confidence post-CSF AT(N) profile disclosure compared to pre-CSF disclosure in five diagnostic subgroups. (A) Alzheimer’s continuum; (B) Non-AD pathologic change; (C) Normal AD biomarkers. Notes: Group Stable AD (dark blue line), Group Change NAD to AD (orange line), Group Stable NAD (grey line), Group Change AD to NAD (yellow line), Group Change NAD to NAD (light blue line). “*” and “****” stand for p<0.05 and p<0.0001, respectively.
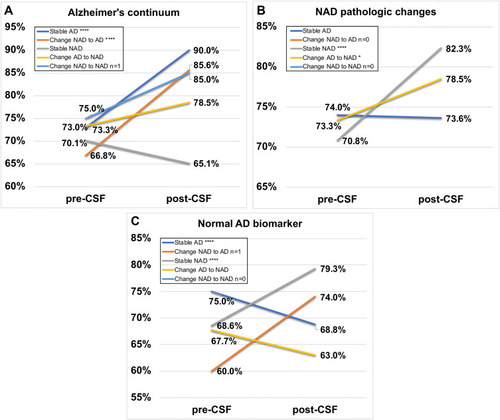
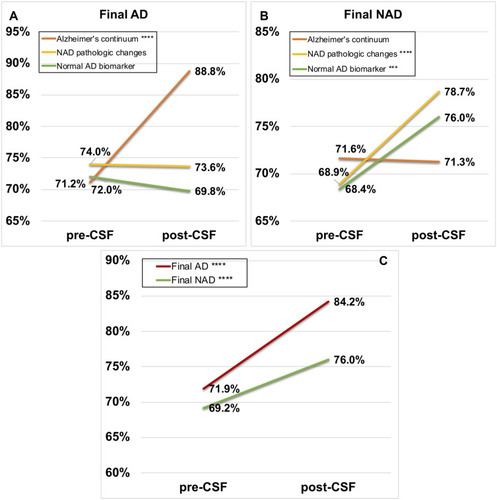
Figure 4 Different changes in diagnostic confidence due to three pathological interpretations of the AT(N) framework and total changes both in Group Final AD and Group Final NAD. In the upper two boxes: Alzheimer’s continuum (orange line), Non-AD pathologic changes (yellow line), Normal AD biomarker (light green line). In the lower box: Final AD (red line), Final NAD (dark green line). (A) Group Final AD; (B) Group Final NAD; (C) Total participants. “***” and “****” stand for p<0.001 and p<0.0001, respectively.