Figures & data
Table 1 Characteristics Among OA Patients and Their Partners
Table 2 Physical Performance of OA Patients and Their Partners
Figure 1 Daytime dependency of the patients' SB before and after arthroplasty. From pre-arthroplasty condition (blue coloring) to post-arthroplasty condition (red coloring), the patients' total time in sedentary bouts decreased (A; p = 0.014) while the average length of sedentary bouts increased (B; p = 0.012). The observed changes were distributed over the course of the day, with the result that no significant change of the investigated parameters could be determined for a single hour (p > 0.999). The data are displayed as M ± 95% CI.
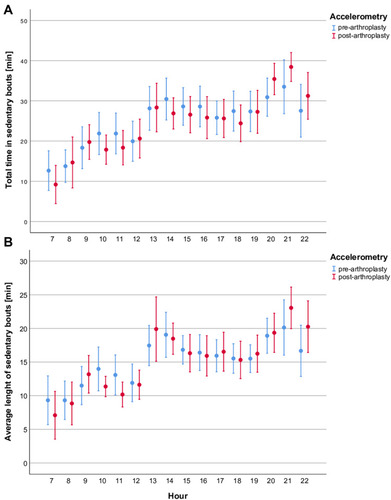
Figure 2 Correlation analysis of the patients’ and their partners’ PA. The correlation of hourly number of steps before arthroplasty (blue coloring, r = 0.630, p < 0.001) and after arthroplasty (red coloring, r = 0.535, p < 0.001) did not change significantly (z = 1.898, p = 0.058).
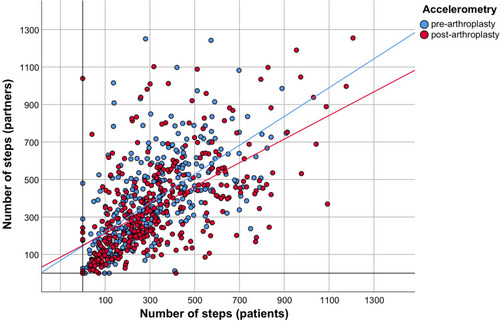
Table 3 Couple-Specific Performance Ratios of Hourly PA and SB
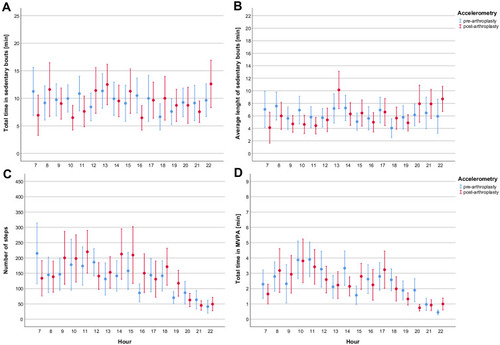
Figure 3 Hourly ratios of the couples’ PA and SB. The hourly deviations of physical performance between the OA patients and their partners were calculated for the accelerometric parameters of SB (A: total time in sedentary bouts, B: average length of sedentary bouts) and PA (C: number of steps, D: total time in MVPA). There were no significant changes from pre-arthroplasty condition (blue coloring) to post-arthroplasty condition (red coloring) (p ≥ 0.205).