
Figures & data
Figure 1 Checklist of risk factors for delayed discharge.
Note: Early discharge planning performed if 3 or more minor items from major items 1 to 6 were applicable, or even 1 minor item from major items 7 to 8.
Abbreviation: ADL, activities of daily living.
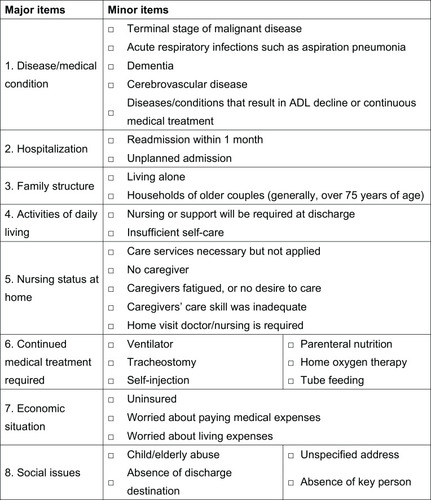
Figure 2 Flowchart of the study.
Abbreviations: HCAP, healthcare-associated pneumonia; HAP, hospital-acquired pneumonia; CAP, community-acquired pneumonia.
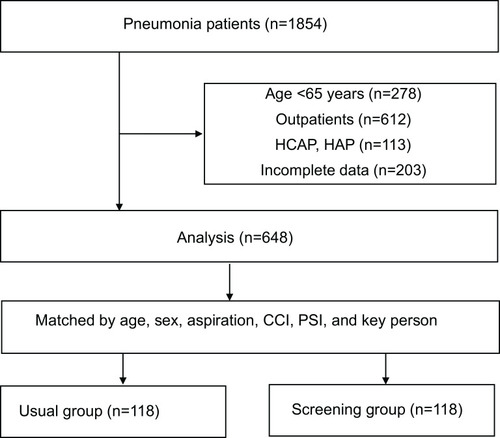
Table 1 Population Demographics, Characteristics, and Outcomes of the Two Groups
Table 2 Matched Pairs in the Two Groups
Table 3 Details of Waiting Time After Antibacterial Treatment for Different Discharge Destinations