Figures & data
Table 1 Theoretical construct definitionsCitation38,Citation63
Figure 1 Sample method.
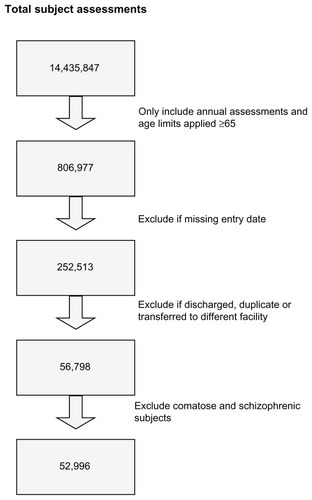
Figure 2 Latent construct pain.
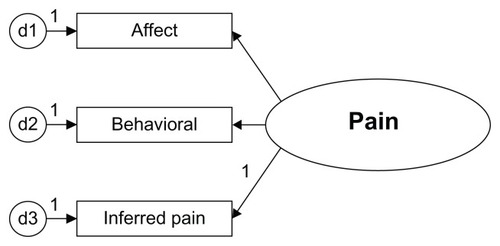
Table 2 Demographic table of resident characteristics
Table 3 Diseases/events with potential pain symptoms
Table 4 Behavioral index
Table 5 Fries pain scale (PS) ratings
Table 6 Preliminary model factoring loadings
Table 7 Definitions of the indicators
Table 8 Correlation matrix of the indicators of pain
Figure 3 Preliminary indicators in model.
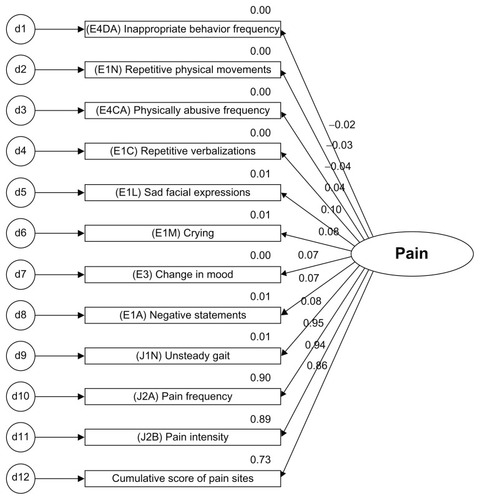
Table 9 Final model factor loadings
Figure 4 Final model.
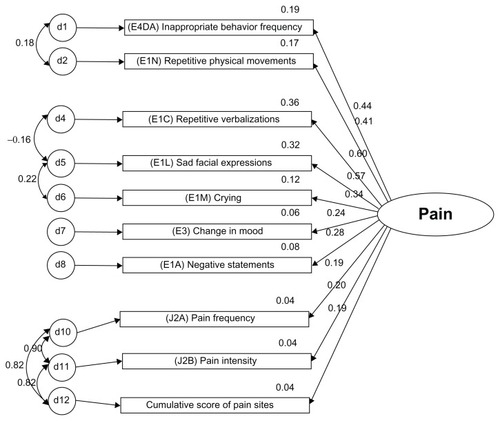
Table 10 Goodness of fit statistics for the measurement models
Table 11 Goodness of fit statistical terms
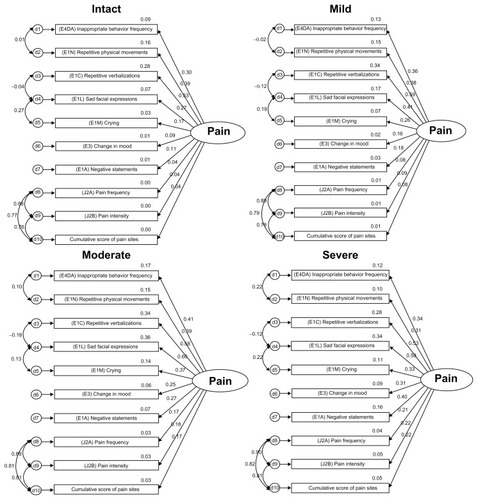
Figure 5 Measurement models by cognitive status with correlations and shared error.