
Figures & data
Table 1 Demographics and Characteristics of Women Awaiting TKA
Figure 1 Distribution of bone quality status of different age groups. *P<0.05, ***P<0.001.
Abbreviation: ns, no significance.
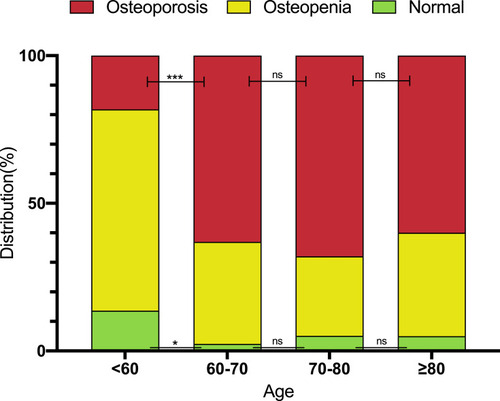
Figure 2 Osteoporosis prevalence based on different DXA examination sites. **P<0.01, ***P<0.001.
Abbreviation: OP, osteoporosis.
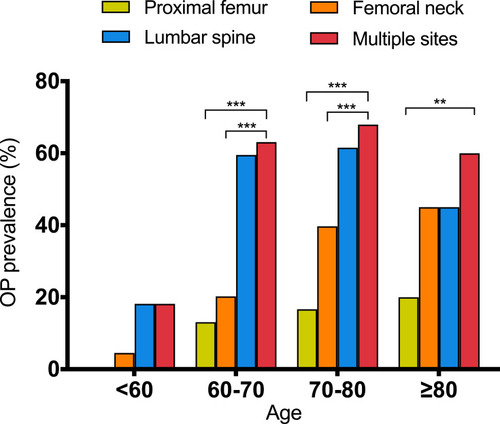
Table 2 The Exact Number of Different Sites Tested Positive for OP and Their Diagnostic Discordance
Figure 3 BMD of the femoral neck (A) and the lumbar spine (B) of different age groups compared to the age/ethnicity-adjusted reference population. *P<0.05, **P<0.01, ***P<0.001.
Abbreviations: BMD, bone mineral density; FN, femoral neck; LS, lumbar spine; ns, no significance.
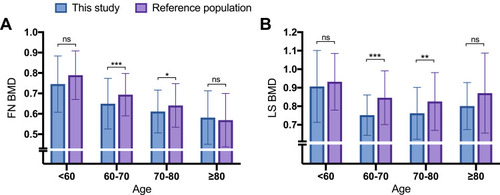
Table 3 Comparison Between Non-OP and OP Women Awaiting TKA
Table 4 Binary Logistic Regression Analysis for the Determination of Independent OP Risk Factors in Postmenopausal Women Awaiting TKA