Figures & data
Table 1 Demographic and Clinical Characteristics of EOCAD Patients and Controls
Table 2 Targeted Amino Acid Information
Figure 1 Serum levels of 4-Hydroxyproline in different sample pool groups. To compare with control (14.622 ± 1.237 μmol/L, n = 8, p < 0.001) and CAD (without MI) groups (13.785 ± 3.031 μmol/L, n = 8, p < 0.001), the serum levels of 4-Hydroxyproline is the lowest in MI group (8.503 ± 1.467 μmol/L, n = 8).
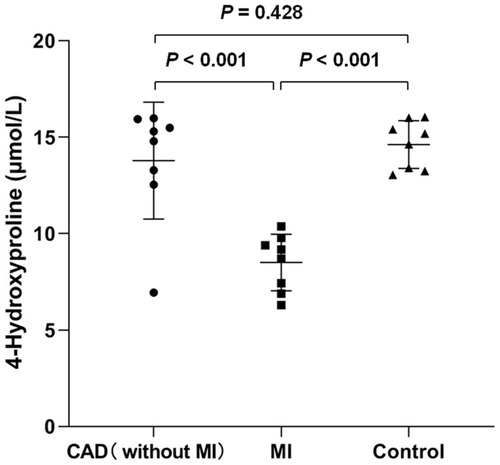
Table 3 Associations Between Serum 4-Hydroxyproline Levels and Presence of MI
Figure 2 Serum 4-Hydroxyproline levels in patient and control groups. Compared with the controls (16.433±4.562 μmol/L, n = 64, p < 0.001) and the CAD (without) patients (15.223±4.225 μmol/L, n = 64, p = 0.122), the serum 4-Hydroxyproline levels were the lowest in the MI patients (9.889 ± 3.635 μmol/L, n = 64).
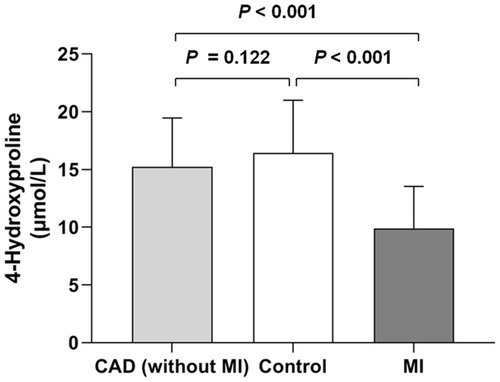
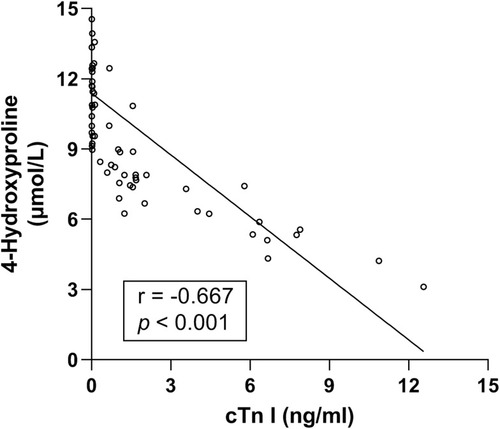
Figure 3 Negative correlation between serum 4-Hydroxyproline and cardiac troponin I (cTn I) levels in MI patients (r = −0.667, 95% CI: −0.7847 to −0.5046, p < 0.001).