
Figures & data
Figure 1 Adapted participant flow through the study.
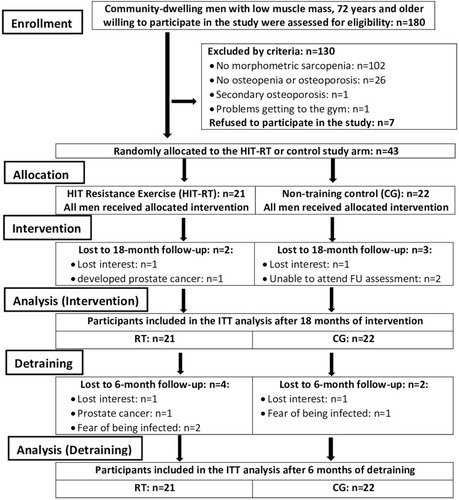
Table 1 Characteristics of the Participants of the High-Intensity Resistance Exercise Training (HIT-RT) and Control Group (CG) at Study Start and After 18 Months of Intervention
Figure 2 Mean values and 95%-CI for changes of lean body mass after training and detraining in the HIT-RT and CG.
Note: *p<0.001.
Abbreviation: n.s., non-significant.
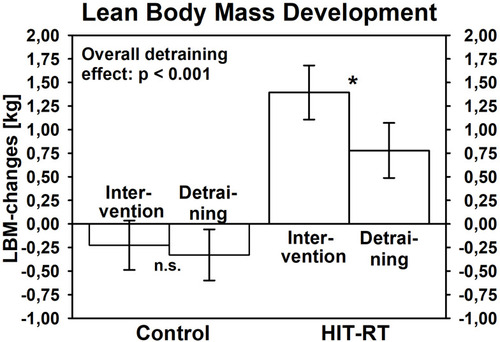
Figure 3 Mean values and 95%-CI for changes of total body fat rate after training and detraining in the HIT-RT and CG.
Note: *p=0.015.
Abbreviation: n.s., non-significant.
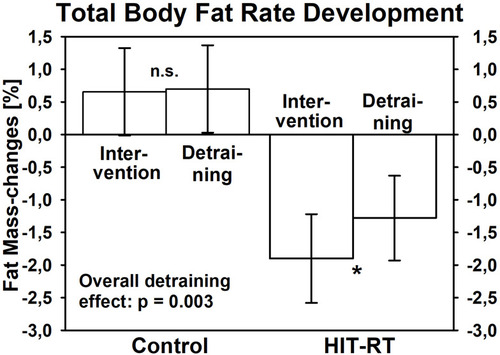
Figure 4 Mean values and 95%-CI for changes of abdominal body fat rate after training and detraining in the HIT-RT and CG.
Note: *p=0.007.
Abbreviation: n.s., non-significant.
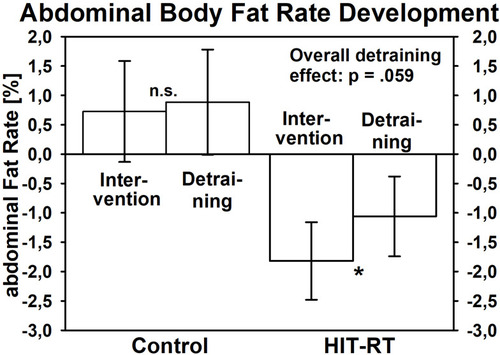
Table 2 Mean Values and 95%-CI for Changes of the Metabolic Syndrome Z-Score After Training and Detraining in the CG and HIT-RT Group