Figures & data
Figure 1 Flowchart for the selection of study participants.
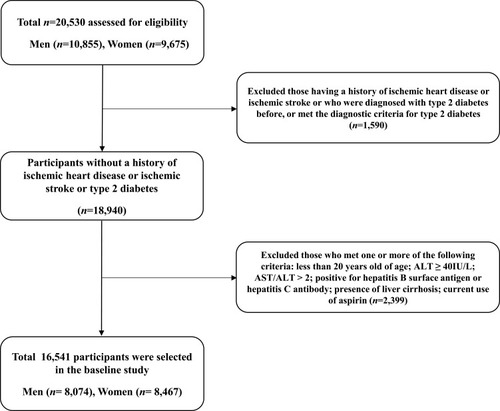
Table 1 Baseline Characteristics of the Study Population
Figure 2 Kaplan–Meier plots indicating the cumulative probability of being diagnosed with ischemic heart disease after the baseline survey.
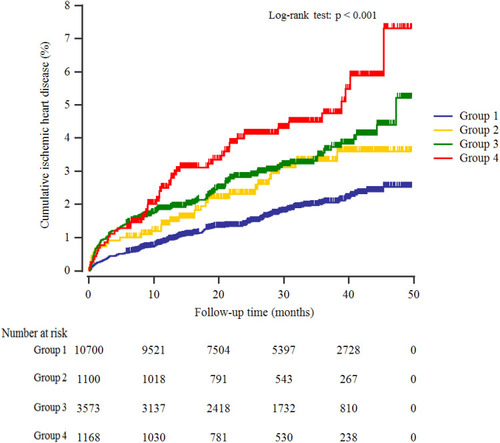
Table 2 Hazard Ratios and 95% Confidence Intervals for New-Onset Ischemic Heart Diseases
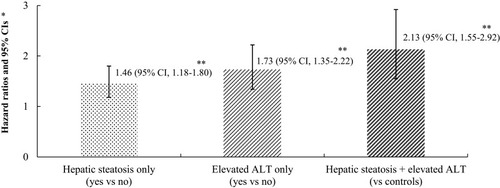
Figure 3 Hazard ratios (95% CIs) for incident ischemic heart disease according to alanine aminotransferase and hepatic steatosis after adjusting for age, sex, body mass index, smoking status, alcohol intake, and physical activity.
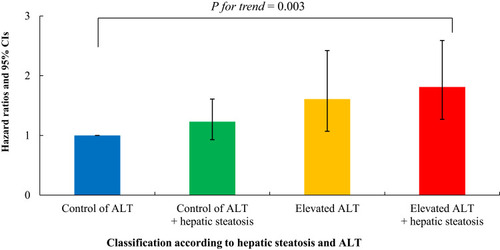
Table 3 Hepatic Steatosis with ALT versus ALT Classification and NAFLD by HSI Score for Predicting Ischemic Heart Disease
Figure 4 Joint effect of hepatic steatosis and elevated alanine aminotransferase for incident ischemic heart disease. *Age- and sex-adjusted Cox proportional hazards regression model analysis. **P value < 0.001.