Figures & data
Table 1 Characteristics of Study Group, Stratified by Metabolically Healthy and Obesity Status
Figure 1 (A) Mean relative grip strength (kg/kg), (B) Mean 4-m walking speed (m/s), (C) Mean TUGT (s). Statistical analysis was performed using ANCOVA. P-values represent the result of Bonferroni corrections after adjusting for age, sex, educational level, marital status, living situation, drinking, smoking, occupation, International Physical Activity Questionnaire (IPAQ), the number of chronic medical conditions. *P < 0.05 versus MHNO; #P < 0.05 versus MHO; ^P < 0.05 versus MUHNO.
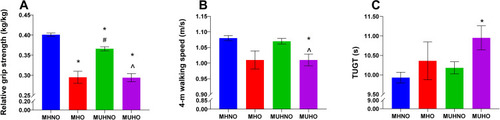
Table 2 Univariate Regression Analysis of the Association Between Metabolic Components, Obesity with Physical Performance Measures
Table 3 Multivariate Linear Regression Analysis of the Association Between Metabolic Components with Physical Performance Measures
Table 4 Stepwise Multivariate Linear Regression Analysis of the Association Between Metabolic Syndrome with Relative Grip Strength
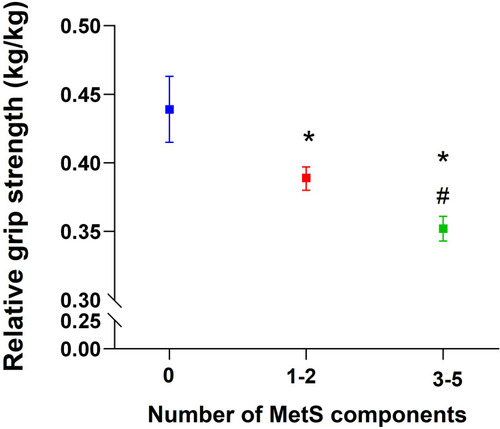
Figure 2 The circled points and error bars represent adjusted mean values and 95% Cl of relative grip strength, respectively. Statistical analysis was performed using ANCOVA. P-values represent the result of Bonferroni corrections after adjusting for age, sex, educational level, occupation, International Physical Activity Questionnaire (IPAQ), the number of chronic medical conditions. Means (95% CI) for the groups of 0 metabolic component, 1–2 metabolic components, and 3–5 metabolic components were 0.439 (0.415–0.463), 0.389 (0.380–0.397) and 0.352 (0.343–0.361), respectively. *P < 0.05 versus 0 metabolic component; #P < 0.05 versus 1–2 metabolic components.