Figures & data
Table 1 Baseline Characteristics of All Patients, and Compared Between Patients Aged <65, 65–74 and ≥75 Years
Table 2 Incidence Rate of Clinical Outcomes According to Age Group
Table 3 Incidence Rate of Ischemic Stroke/TIA According to Age Group and CHA2DS2-VASc Score
Figure 1 Incidence rate of ischemic stroke (IS)/transient ischemic attack (TIA), major bleeding (MB), intracerebral hemorrhage (ICH), heart failure (HF), and death compared between patients aged <65, 65–74, and ≥75 years.
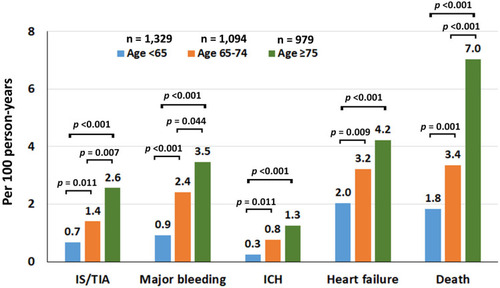
Figure 2 Forest plot of unadjusted and adjusted hazard ratios and their 95% confidence intervals for ischemic stroke/transient ischemic attack (TIA), major bleeding, intracerebral hemorrhage (ICH), heart failure, and death in patients aged 65–74, and ≥75 years as compared to those aged <65 years (<65 years was used as a reference).
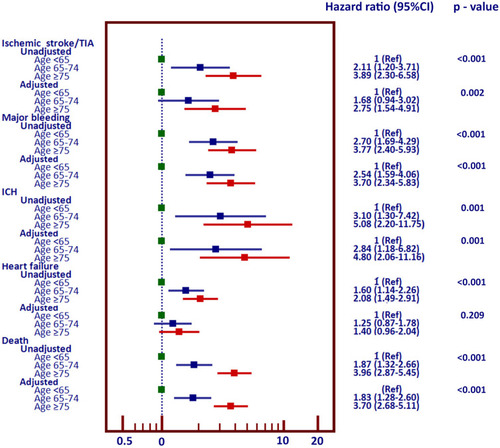
Figure 3 Cumulative event rate for ischemic stroke/transient ischemic attack (TIA), major bleeding, intracerebral hemorrhage (ICH), and death over time compared between patients aged <65, 65–74, and ≥75 years. A-C: unadjusted analysis. D-F: analysis adjusted for confounders.
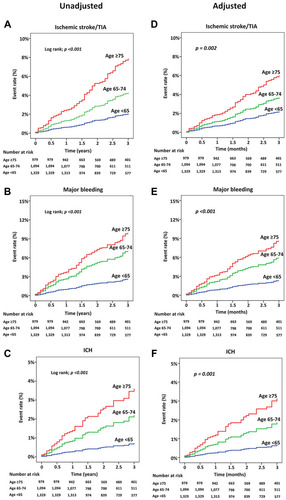
Figure 4 Cubic spline graph of adjusted hazard ratio (blue line) and 95% confidence interval (purple shaded area) (Y-axis) relative to age (X-axis) for (A) ischemic stroke/transient ischemic attack (TIA), (B) major bleeding, (C) intracerebral hemorrhage (ICH), and (D) death.
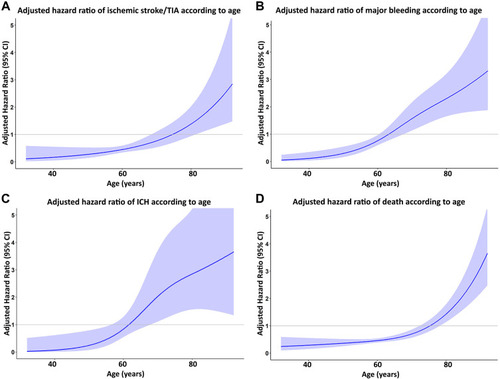
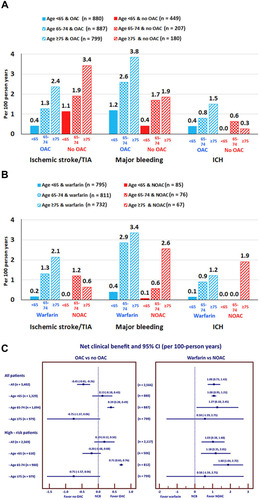
Figure 5 Rate of ischemic stroke (IS)/transient ischemic attack (TIA), major bleeding, and intracerebral hemorrhage (ICH) according to age and oral anticoagulant (OAC) status (A), and according to age compared between warfarin and non-vitamin K antagonist oral anticoagulant (NOAC) (B). Net clinical benefit (NCB) and 95% confidence interval (CI) according to age compared between OAC and no OAC, and between NOAC and warfarin (C).