
Figures & data
Table 1 Biodemographic and Fracture-Related Features of Patients
Figure 1 Distribution of the study population represented in an area chart over the different categories of the geriatric scores analyzed: Barthel Index (A), Katz Index (B), Lawton-Brody Index (C), and Physical Red Cross Scale (D). The orange line on the left axis represents the probability of death at 30 days with 95% confidence intervals. The discontinuous blue line marks the mean 30-day mortality rate.
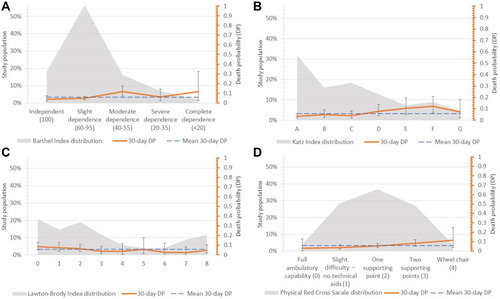
Table 2 Barthel Index and Katz Index Distribution Along the Study Population
Figure 2 Bar chart of the survival and early mortality population for Barthel Index (A), Katz Index (B), Lawton-Brody Index (C), and Physical Red Cross Scale (D).
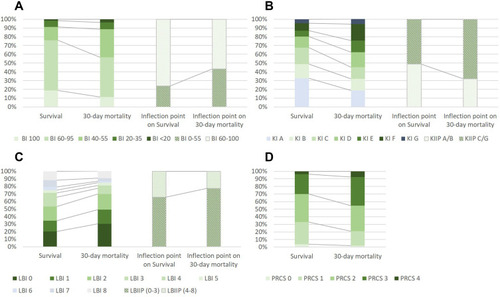
Table 3 Lawton-Brody Index and Physical Red Cross Scale Distribution Along the Study Population