
Figures & data
Table 1 Diagnostic Criteria for MODSEa
Table 2 Baseline Characteristics and Differences Between Low-Risk Group and High-Risk Group
Table 3 Perioperative Information and Differences Between Low-Risk Group and High-Risk Group
Figure 1 Incidence of MODSE and single organ dysfunction in 168 patients. Figure shows the overall incidence of organ dysfunction and its distribution between the two groups.
Abbreviations: MODSE, multiple organ dysfunction syndrome in the elderly; CNS, central nervous system; PC, peripheral circulation; GT gastrointestinal tract; CS coagulation system.
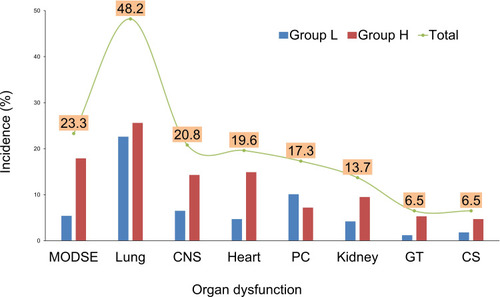
Table 4 Admission High-Sensitivity Troponin T and Perioperative Outcomes