Figures & data
Table 1 Baseline Characteristics of Elderly Patients with Stable Chronic Obstructive Pulmonary Disease (COPD), Classified According to Frailty
Figure 1 Distribution of frailty phenotypic characteristics assessed using Fried frailty phenotypes in older patients with stable chronic obstructive pulmonary disease (COPD).
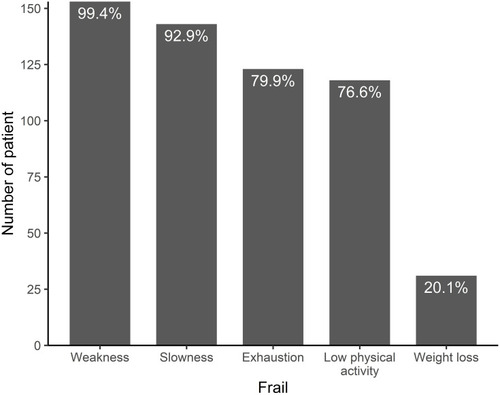
Table 2 Results for 1-Year Acute Exacerbation of COPD, All-Cause Hospitalization, and Mortality in Frail and Non-Frail Elderly Patients with Stable COPD
Table 3 Effects of Frailty and Its Characteristics on 1-Year Acute Exacerbation, All-Cause Hospitalization, and All-Cause Mortality in Older Patients with Stable COPD
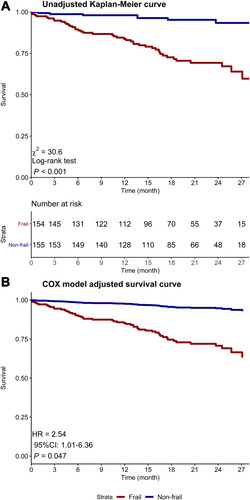
Figure 2 Comparison of unadjusted and adjusted survival curves of patients age ≥ 65 years with stable COPD stratified according to frailty (Fried phenotype score ≥ 3). (A) Unadjusted Kaplan–Meier curve. (B) Survival curves adjusted by age, gender, CCI, medication, GOLD severity, moderate-to-severe exacerbation history, and CAT. Frail patients had a higher mortality.