Figures & data
Figure 1 HG upregulated the levels of MALAT1, mTOR and p-tau in hippocampus cells. (A) The protein levels of mTOR were detected by Western blot in HG-treated hippocampus cells. (B) The protein levels of tau and p-tau were detected by Western blot in HG-treated hippocampus cells. (C) Real-time PCR analysis of mTOR and tau mRNA levels in HG-treated hippocampus cells. (D) Real-time PCR analysis of the levels of MALAT1 and miR-144 in HG-treated hippocampus cells. N = 3; ** p < 0.01 and *** p < 0.001.
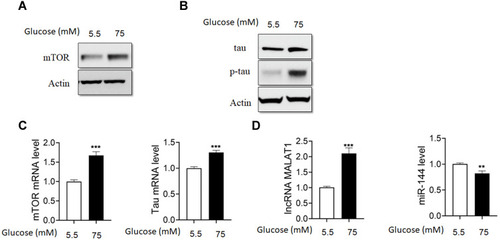
Figure 2 Silencing of MALAT1 attenuated the effects of HG on the levels of mTOR, tau and p-tau in hippocampus cells. (A) The relative expression of MALAT1 was detected by qRT-PCR in hippocampus cells transfected with si-NC or si-MALAT1. (B and C) Hippocampus cells were transfected with si-NC or si-MALAT1, or treated with rapamycin, and 24 h later the cells were treated with HG (75 mM) for 24 h, and protein levels of mTOR, tau and p-tau were determined by Western blot assay. N = 3; ** p < 0.01.
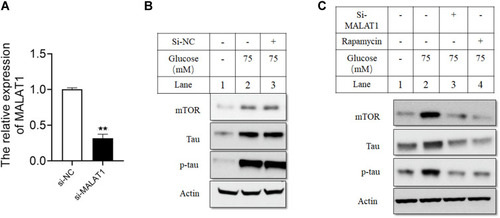
Figure 3 MALAT1 acted as a sponge for miR144 in hippocampus cells. (A) The predicted binding sites with complementary alignments between MALAT1 and miR-144. (B) miR-144 expression was determined by qRT-PCR in hippocampus cells transfected with NC or miR-144 mimics. (C and D) Relative luciferase activity of wild type or mutant reporter vector in hippocampus cells transfected with NC or miR-144 mimics. (E and F) The relative expression of miR-144 in hippocampus cells transferred with si-NC or si-MALAT1 or inhibitors NC or miR144 inhibitors. (G) Hippocampus cells were transfected with siRNAs and miRNAs, and 24 h later cells were treated with HG (75 mM) for 24 h. The protein levels of mTOR, tau and p-tau were determined by Western blot. N = 3; ** p < 0.01 and *** p < 0.001.
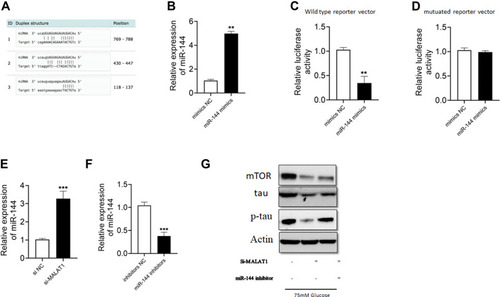
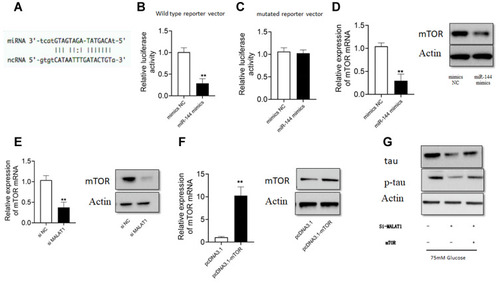
Figure 4 Silencing of MALAT1 attenuated the effects of HG on p-tau level in hippocampus cells. (A) The predicted binding site of the complementary sequences between mTOR 3ʹ UTR and miR-144. (B and C) The relative luciferase activity of wild type or mutant reporter vector in hippocampus cells transfected with NC or miR-144 mimics. (D and E) The mRNA and protein levels of mTOR in hippocampus cells transfected with NC or miR-144 mimics, or si-NC or si-MALAT1. (F) The mRNA and protein levels of mTOR in hippocampus cells transfected with pcDNA3.1 or pcDNA3.1-mTOR. (G) Hippocampus cells were transfected with different siRNAs or plasmid constructs, and 24 h later, cells were treated with HG (75 mM) for 24 h, and protein levels of tau and p-tau were detected by Western blot analysis. N = 3; ** p < 0.01.