Figures & data
Table 1 Characteristics of Study Participants
Table 2 Relationship Between Different Blood Pressure Indicators and the Risk of Stroke
Figure 1 Nomogram constructed from baseline related indicators.
Notes: To calculate participants’ stroke incident probability, points for each parameter are assigned by corresponding values from the “Points” axis, and sum of the points is plotted on “Total points” axis. The stroke incident probability is the value at a vertical line from corresponding total points.
Abbreviations: SBP, systolic blood pressure; DBP, diastolic blood pressure; PP, pulse pressure; MAP, mean arterial pressure; PPI, pulse pressure index.
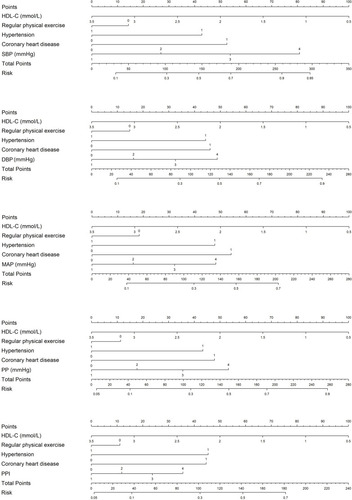
Figure 2 Internal calibration plots of nomogram calibration curves for each blood pressure indicators: (A) SBP, (B) DBP, (C) MAP, (D) PP, and (E) PPI.
Notes: The 45°line represents a perfect match between the actual survival outcome (y-axis) and nomogram-predicted survival (x-axis). Closer distance from the points to the 45°line indicates higher prediction accuracy.
Abbreviations: SBP, systolic blood pressure; DBP, diastolic blood pressure; PP, pulse pressure; MAP, mean arterial pressure; PPI, pulse pressure index.
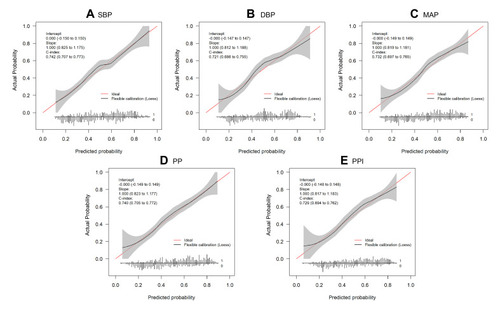
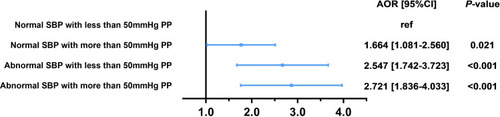
Figure 3 Forest plots for different SBP and PP conditions.
Notes: SBP was formed into normal group and abnormal group according to 140mmHg, PP was formed into group according to 50mmHg. Multivariate model-controlled baseline HDL-C level, drinking history, regular physical exercise, medical history and medications.
Abbreviations: AOR, adjusted odds ratio; SBP, systolic blood pressure; PP, pulse pressure.