
Figures & data
Table 1 Characteristics of Study Participants
Table 2 Comparison of Older Adults with and without Low SMI and ROC Analysis for Low SMI
Figure 1 Receiver operating characteristic curve analysis of MT for predicting low SMI. (A) males. AUC: 0.836, cut-off value: 5.67 cm. (B) females. AUC: 0.748, cut-off value: 1.42 cm.
Abbreviations: MT, muscle thickness; SMI, skeletal muscle mass index; AUC, area under the curve; TS, triceps surae; GM, medial head of gastrocnemius.
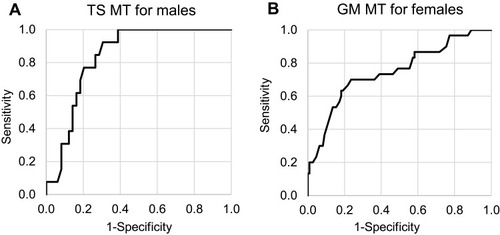
Table 3 Cut-off Values of MT Based on 2 SD Below the Young Adult Means for Corresponding Muscles