Figures & data
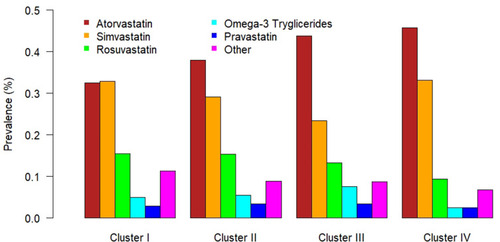
Figure 1 Flow-chart of the study.
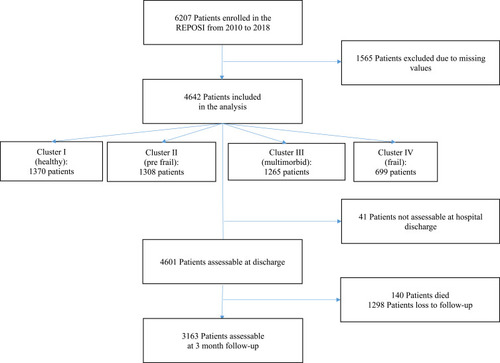
Table 1 Patients’ Characteristics at Hospital Admission According to the Health State Profile Identified
Table 2 Results of Logistic Regression Model (or, 95% CI) to Assess the Impact of the Health State Profile and Statin Use, Adjusted for Health State Profile, on Main Clinical Outcomes
Table 3 Results of Logistic Regression Model (or (95% CI)) to Assess the Association Among Diagnosis of Dyslipidemia (A) and Statin Prescription (B) with Cluster Assignment
Figure 2 Barplot of the distribution of lipid lowering drugs according to cluster assignment.