
Figures & data
Figure 1 Flow chart of participants.
Abbreviations: mITT, modified intention-to-treat, all participants followed the random allocation with outcome data; PP, per-protocol, participants followed the random allocation with outcome data and attending the final outcome assessment.
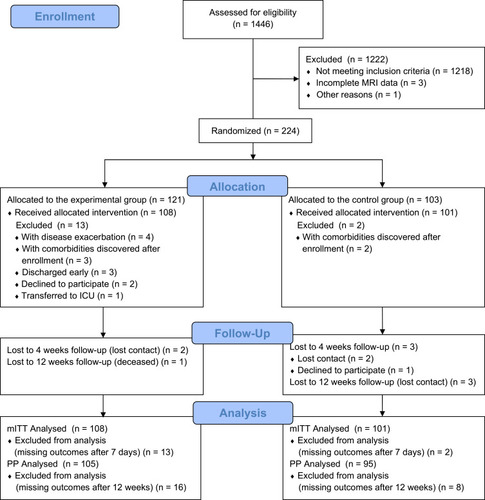
Table 1 Baseline Demographic and Clinical Characteristics Between Groups
Table 2 Between-Group Difference on Primary Outcomes After 7 Days Treatment (PP Analysis, n=200)
Figure 2 Treatment difference and non-inferiority margin. (A) Non-inferiority test for the modified intention-to-treat dataset, n = 209. (B) Non-inferiority test for the per-protocol dataset, n = 200.
Notes: Data are means (symbols) and 95% CIs (error bars) for the primary outcome difference (T-C) between nurse-led (the test group, T) and therapist-led (the control group, C) rehabilitation after seven days of treatment. The dotted lines represent the non-inferiority margins (δ).
Abbreviations: MAS, Motor Assessment Scale, δ = −6.94; FMA, Fugl-Meyer Assessment, δ = −12; ARAT, Action Research Arm Test, δ = −10.
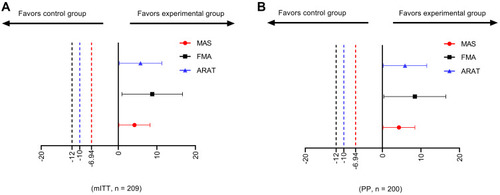
Table 3 Median (IQR) Secondary Outcomes Scores for Each Group, and Results of GEE Analysis (PP Analysis, n = 200; Experimental Group n = 105, Control Group n = 95)