Figures & data
Figure 1 Patient flow diagram.
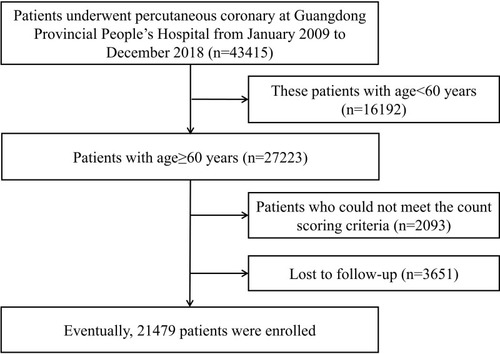
Table 1 Malnutrition Screening Tools
Table 2 Baseline Characteristic in the Elder Patients Undergoing PCI Stratified by CONUT Score
Figure 2 Distribution of CONUT scores. A score of 0 to 1 is considered as absent; scores of 2 to 4, 5 to 8, and 9 to 12 reflect mild, moderate, and severe malnutrition, respectively.
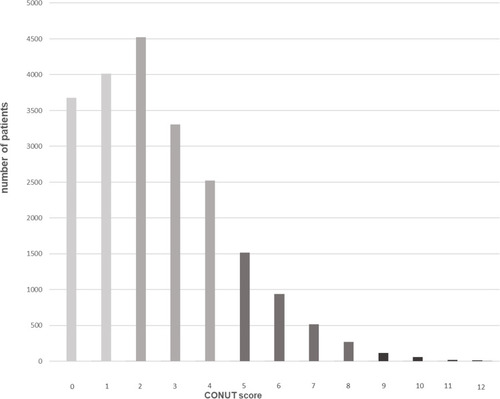
Table 3 Univariate and Multivariate Cox Proportional Hazards Model for the Association Between Malnutrition and All-Cause Death
Figure 3 Kaplan–Meier curves for all-cause mortality by the CONUT score. A score of 0 to 1 is considered as absent; scores of 2 to 4, 5 to 8, and 9 to 12 reflect mild, moderate, and severe malnutrition, respectively.
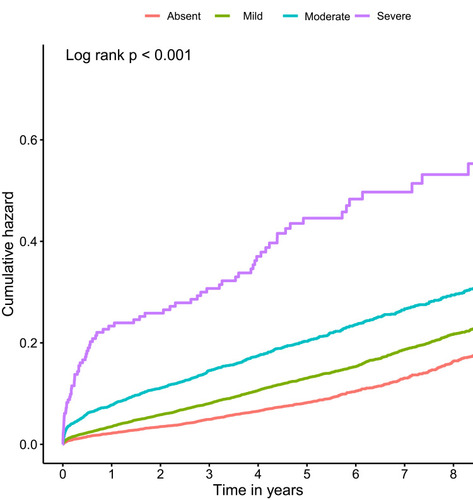
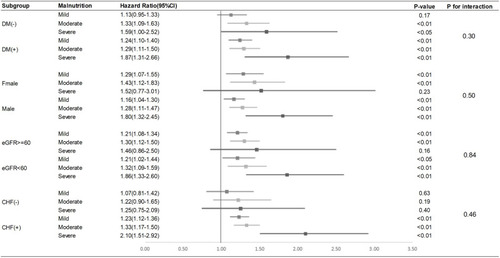
Figure 4 Forest plots of hazard ratios for the primary endpoint in different subgroups. Adjusted by age, gender, anemia, acute myocardial infarction, angiotensin-converting enzyme inhibitors or angiotensin receptor blockers, beta-blockers, chronic kidney disease, congestive heart failure, diabetes mellitus, diabetes mellitus, hypertension, statins, atrial fibrillation.