Figures & data
Figure 1 Intraoperative radiological images. (A) Build a working cannula through unilateral pedicle approach. (B) Inflate balloon and push open VBS. (C and D) Adjust the balloon placement and completely push open VBS. (E and F) Remove balloon and inject filler material, then remove working cannula.
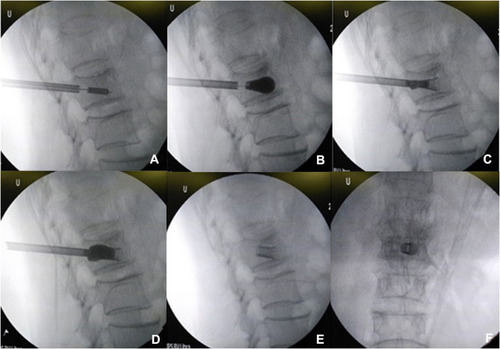
Table 1 Clinical Data Comparison in Three Groups
Figure 2 The clinical and radiological evaluation indicators trend. Three groups were not significantly different from each other for each evaluation indicator preoperatively and at each postoperative follow-up point (P>0.05). (A) AH. (B) Cobb angle. (C) VAS. (D) ODI.
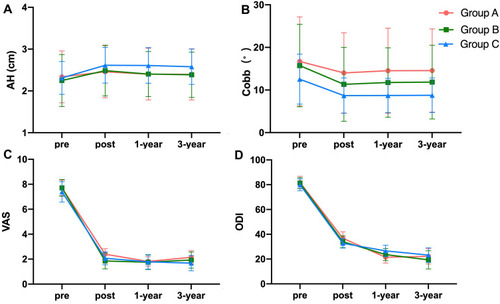
Table 2 The Radiological Data Preoperatively and at Each Postoperative Time Point
Figure 3 A typical case of vertebral height (L1) loss during the follow-up. (A) Coronal image at 1 day after operation. (B) Coronal image at 1 year after operation. (C) Coronal image at 3 years after operation. (D) Sagittal image at 1 day after operation. (E) Sagittal image at 1 year after operation. (F) Sagittal image at 3 years after operation.
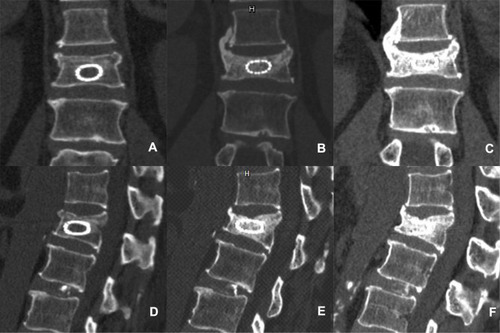
Table 3 The CT Value of Inside and Outside VSB at Each Postoperative Time Point
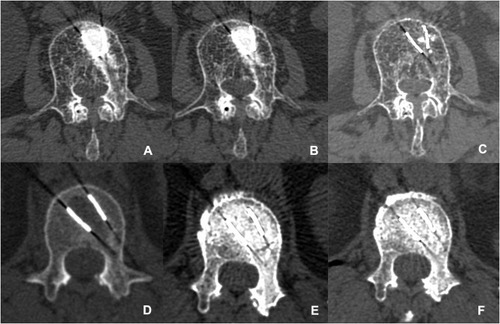
Figure 4 The evaluation of bone trabecula formation and density variation inside and outside the VBS at 1 day, 1 year and 3 years after operation. (A–C) Group A. (D–F). Group B.