Figures & data
Figure 1 Static training device and data acquisition system for rats. The design and logic of data acquisition during training are illustrated in (A). (B) Schematic diagram of this device. In static training, the hind limbs were fixed, and then they habitually curled up; naturally, the upper limbs grasped the sensor. This grip force was converted into an electrical signal, amplified by the signal amplifier, and was finally presented in the computer software system. (C) Real-time data collected in different channels.
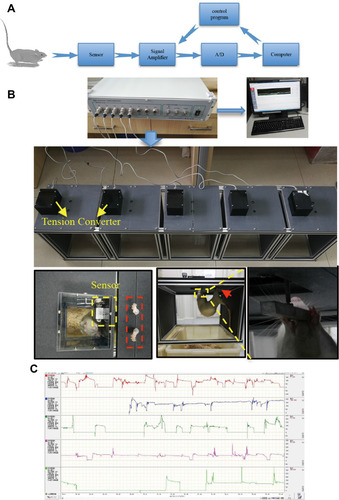
Figure 2 Local PGC-1αinterference in the middle point of the biceps brachii. Local PGC-1αinterference and procedures used to harvest samples are shown in (A). The PGC-1α siRNA was injected twice a week until the final static training session (for 8 weeks). At week 3, local muscle tissue was collected, and PGC-1α expression was measured using immunohistochemistry (n=3), magnification 100 × in (B). (C–F) PGC-1α and FNDC5 levels in local biceps brachii (C–E) and UCP1 levels in surrounding adipose tissue of the local biceps brachii (C and F) (n=3). The level of significance is **p≤0.01, n=3.
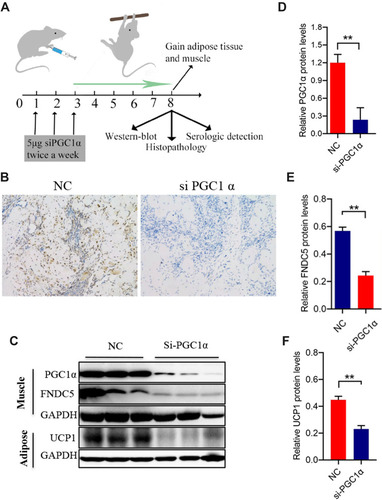
Figure 3 Effects of static training on muscle motor ability and local PGC-1α transcription. Rat body weights were measured (A) after eight weeks of static training (n=9). The rest time (B) (n=9) and training time (C) (n=9) were recorded at weeks 2, 4, 6, and 8. After the final training session, the grip force/body weight ratio was measured (D), and ATP level in local muscle tissue was also detected (E). We also evaluated the cross-section area in the exercise and no exercise group using HE staining (F) and the corresponding statistical results were shown in (G). The levels of PGC 1α and its downstream intermediate FNDC5 were measured using WB (H and I). The levels of significance are *p≤0.05, **p≤0.01, ***p≤0.001, and ns=no significant difference. Scale bar=200um.
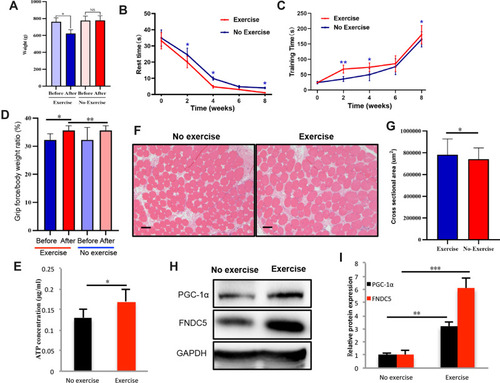
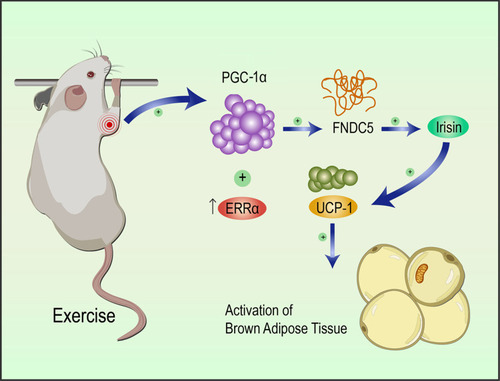
Figure 4 Static training facilitated the activation of the PGC-1α pathway. Morphological changes were observed in the muscle, and adipose tissues after static strength training using HE staining (A), and the cross-section area in each field at 10× magnification was calculated (B). ATP level in tissue from rats in WT, siPGC-1α and exercise groups were measured as shown in (C). PGC 1α/FNDC5 levels in the local biceps brachii and UCP1 levels in the surrounding adipose tissue were detected using WB (D) and immunohistochemistry (F). The statistical results are displayed in (E and H) (n=6). Serum irisin levels were measured using an ELISA (G). The levels of significance are *p≤0.05, **p≤0.01, and ***p≤0.01.Proposed model for the beneficial effects of static training on muscle function. Static training promoted PGC 1α expression in the local biceps brachii, which activated the downstream intermediate FNDC5, increasing serum irisin and UCP1 levels in the adipose tissue surrounding the biceps brachii (G). Scale bar=200um in (A and F).
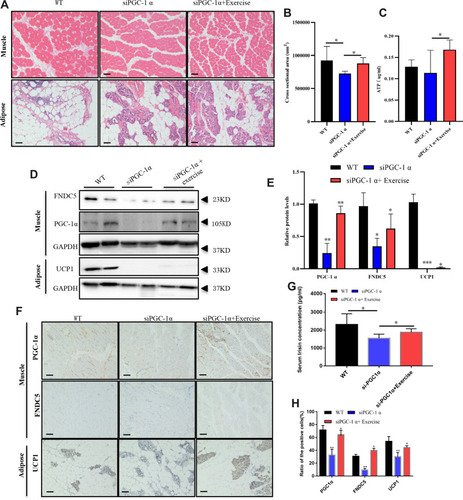
Figure 5 Mechanisms of static strength training against muscle atrophy.