Figures & data
Figure 1 The location of the acupoints for transcutaneous electrical acupoint stimulation.
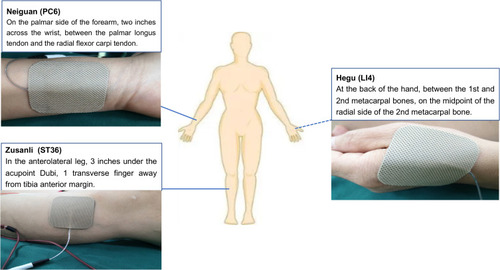
Figure 2 Experimental flow of this study.
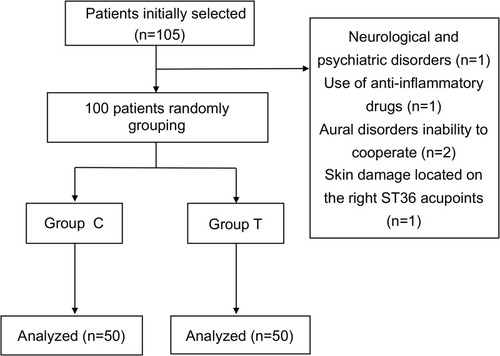
Table 1 Clinical Characteristics of Patients
Table 2 Intraoperative and Postoperative Variables
Figure 3 The level of IL-6 (A), hs-CRP (B), and CGRP (C) at different time points. Compared to T0, *P < 0.05 in the same group. Compared to the corresponding Group C, #P < 0.05. T0: 0 min before transcutaneous electrical acupoint stimulation, T1: 1 h after the beginning of surgery; T2: the end of surgery.
Abbreviations: IL-6, interleukin-6; hs-CRP, high sensitive C-reactive protein; CGRP, calcitonin-gene-related peptide.
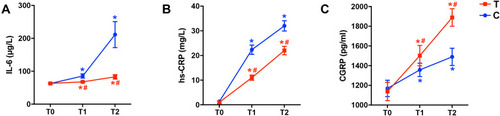
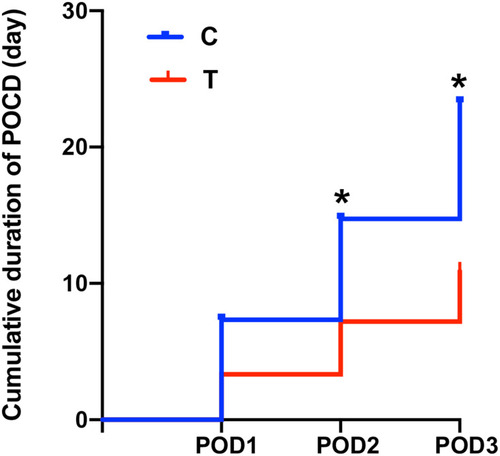
Figure 4 Cumulative duration of postoperative cognitive decline. Compared to the corresponding Group C, *P < 0.05.