Figures & data
Figure 1 Flow diagram showing the patient selection process.
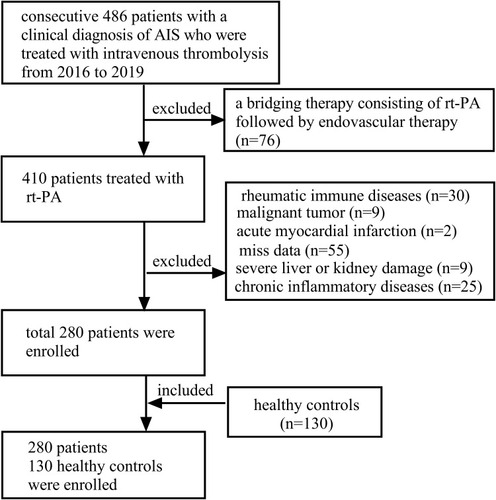
Table 1 Demographic and Laboratory Characteristics of AIS Patients and Healthy Controls
Table 2 Characteristics of AIS Patients According to EMR Tertiles
Table 3 Comparison of Clinical Characteristics Between Good and Poor Outcome (or Alive and Dead)
Figure 2 (A) Distribution of NIHSS on admission in the tertiles of increasing EMR levels. (B) Distribution of 3-month mRS scores in the tertiles of increasing EMR levels.
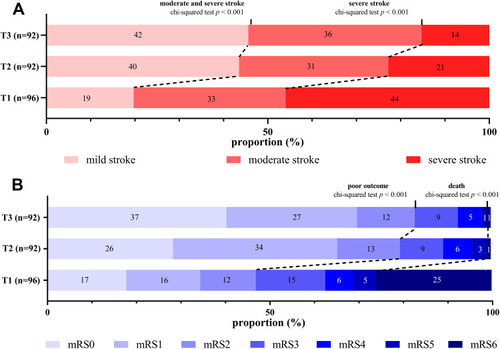
Table 4 Univariate Logistic Regression Analyses for Prognosis
Table 5 Adjusted Models for Prognosis at 3 Months
Table 6 Diagnostic Values of the EMR, NLR, PLR and NLR + EMR for Stroke Outcome
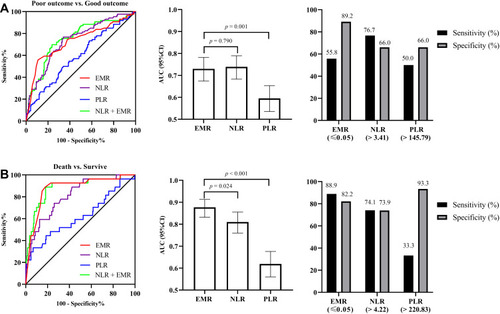
Figure 3 (A) Receiver operating characteristic curve (ROC) of EMR, NLR, PLR and NLR + EMR on the prognosis of AIS patients between poor outcome and good outcome. (B) Receiver operating characteristic curve (ROC) of EMR, NLR, PLR and NLR + EMR on the prognosis of AIS patients between death and survive.