Figures & data
Figure 1 Patient selection flowchart.
Abbreviations: sICAS, symptomatic intracranial atherosclerosis; TIA, transient ischemic attacks.
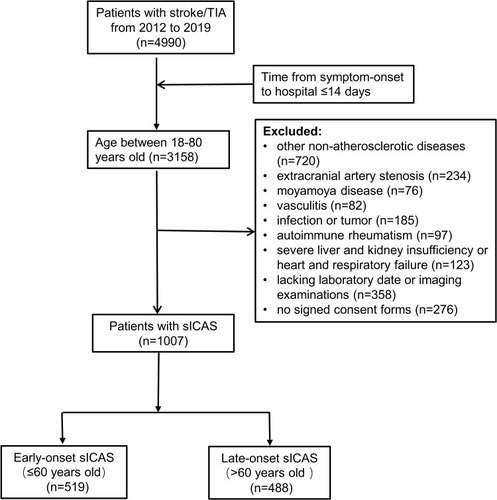
Table 1 Baseline Characteristics of sICAS Patients
Figure 2 Different stenosis characteristics between early-onset and late-onset sICAS group (A-C).
Notes: Early-onset sICAS group defined as age ≤60 years old and late-onset sICAS group defined as age >60 years old; P-values <0.05 were considered statistically significant.
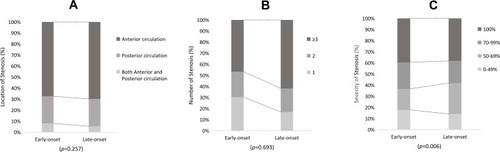
Table 2 Comparison of Demographic, Laboratory and Clinical Features in Patients with Early and Late-Onset sICAS
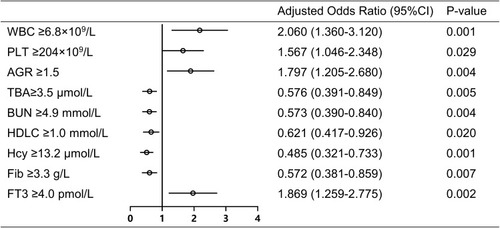
Figure 3 Logistic regression analyses for factors independently associated with the early-onset sICAS.
Notes: The cut-off value for each biomarker was determined by the median. P-values <0.05 were considered statistically significant.