
Figures & data
Table 1 Characteristics of Included Participants
Figure 1 Values of skin surface lipids, transepidermal water loss, and stratum corneum hydration measured at vertex and occipital areas of males with androgenetic alopecia (AGA) and healthy controls. †Statistically significant difference between vertex and occipital areas of males with AGA, *Statistically significant difference between AGA and control groups.
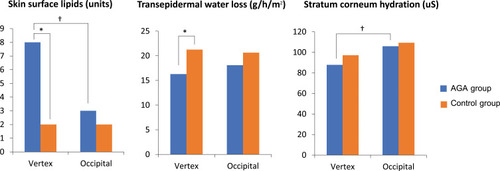
Figure 2 Scatter plots of skin surface lipids, transepidermal water loss, and stratum corneum hydration measured at vertex and occipital areas of males with androgenetic alopecia, showing correlation coefficient (r). *Statistically significant.
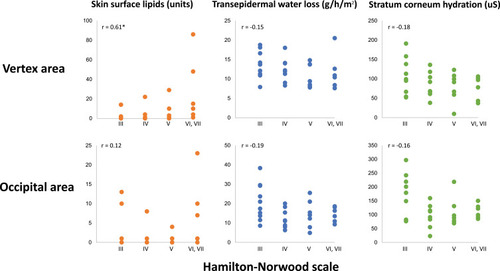
Table 2 Comparison of Measured Values Between Androgenetic Alopecia and Control Groups